|
Download Data (XLS File) |
|
||||||||
|
||||||||
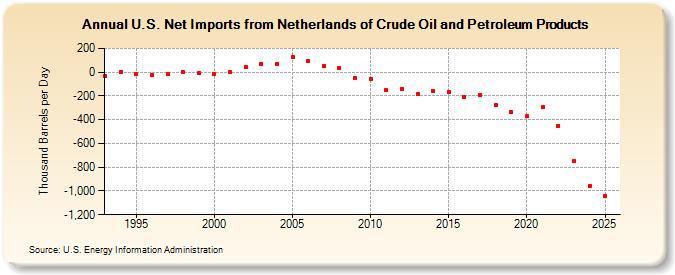
| U.S. Net Imports from Netherlands of Crude Oil and Petroleum Products (Thousand Barrels per Day) | ||||||||
| Decade | Year-0 | Year-1 | Year-2 | Year-3 | Year-4 | Year-5 | Year-6 | Year-7 | Year-8 | Year-9 |
|---|---|---|---|---|---|---|---|---|---|---|
| 1990's | -35 | 2 | -18 | -24 | -17 | -2 | -11 | |||
| 2000's | -12 | -2 | 42 | 72 | 65 | 126 | 90 | 48 | 37 | -52 |
| 2010's | -57 | -149 | -140 | -185 | -157 | -169 | -205 | -189 | -275 | -337 |
| 2020's | -373 | -293 | -450 | -779 |
| - = No Data Reported; -- = Not Applicable; NA = Not Available; W = Withheld to avoid disclosure of individual company data. |
| Release Date: 3/29/2024 |
| Next Release Date: 8/30/2024 |