|
Download Data (XLS File) |
|
||||||||
|
||||||||
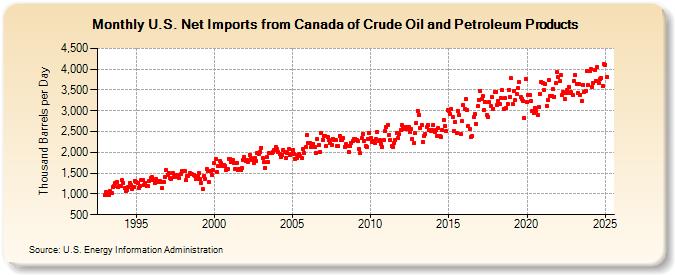
| U.S. Net Imports from Canada of Crude Oil and Petroleum Products (Thousand Barrels per Day) | ||||||||
| Year | Jan | Feb | Mar | Apr | May | Jun | Jul | Aug | Sep | Oct | Nov | Dec |
|---|---|---|---|---|---|---|---|---|---|---|---|---|
| 1993 | 975 | 1,043 | 963 | 972 | 1,069 | 1,029 | 1,166 | 1,182 | 1,263 | 1,288 | 1,155 | 1,200 |
| 1994 | 1,179 | 1,324 | 1,269 | 1,140 | 1,078 | 1,106 | 1,156 | 1,272 | 1,213 | 1,113 | 1,177 | 1,305 |
| 1995 | 1,290 | 1,252 | 1,150 | 1,186 | 1,342 | 1,344 | 1,212 | 1,265 | 1,192 | 1,188 | 1,317 | 1,373 |
| 1996 | 1,395 | 1,332 | 1,255 | 1,348 | 1,320 | 1,295 | 1,299 | 1,291 | 1,143 | 1,298 | 1,417 | 1,564 |
| 1997 | 1,464 | 1,498 | 1,389 | 1,369 | 1,500 | 1,411 | 1,425 | 1,463 | 1,399 | 1,381 | 1,472 | 1,557 |
| 1998 | 1,551 | 1,543 | 1,327 | 1,420 | 1,442 | 1,505 | 1,479 | 1,472 | 1,451 | 1,439 | 1,350 | 1,435 |
| 1999 | 1,498 | 1,349 | 1,259 | 1,109 | 1,432 | 1,362 | 1,610 | 1,551 | 1,277 | 1,552 | 1,456 | 1,569 |
| 2000 | 1,740 | 1,833 | 1,526 | 1,667 | 1,789 | 1,745 | 1,681 | 1,694 | 1,676 | 1,577 | 1,590 | 1,849 |
| 2001 | 1,831 | 1,761 | 1,820 | 1,752 | 1,607 | 1,754 | 1,583 | 1,597 | 1,583 | 1,627 | 1,804 | 1,886 |
| 2002 | 1,798 | 1,826 | 1,765 | 1,944 | 1,866 | 1,809 | 1,751 | 1,873 | 1,788 | 1,976 | 1,967 | 2,007 |
| 2003 | 2,114 | 1,864 | 1,766 | 1,630 | 1,881 | 1,776 | 1,977 | 1,986 | 1,973 | 2,016 | 2,051 | 2,130 |
| 2004 | 2,079 | 2,004 | 1,952 | 1,890 | 1,928 | 2,063 | 2,019 | 1,864 | 1,988 | 2,085 | 1,932 | 1,961 |
| 2005 | 2,063 | 1,955 | 1,846 | 1,859 | 1,946 | 1,967 | 1,905 | 1,868 | 2,074 | 1,987 | 2,121 | 2,416 |
| 2006 | 2,234 | 2,220 | 2,119 | 2,166 | 2,203 | 2,120 | 1,991 | 2,322 | 2,172 | 2,009 | 2,477 | 2,304 |
| 2007 | 2,385 | 2,393 | 2,151 | 2,358 | 2,300 | 2,213 | 2,183 | 2,327 | 2,301 | 2,287 | 2,158 | 2,144 |
| 2008 | 2,403 | 2,296 | 2,288 | 2,338 | 2,131 | 2,190 | 2,142 | 2,004 | 2,146 | 2,226 | 2,261 | 2,325 |
| 2009 | 2,322 | 2,300 | 2,268 | 2,075 | 1,983 | 2,337 | 2,443 | 2,280 | 2,142 | 2,134 | 2,321 | 2,472 |
| 2010 | 2,348 | 2,251 | 2,276 | 2,231 | 2,313 | 2,498 | 2,284 | 2,286 | 2,201 | 2,129 | 2,294 | 2,510 |
| 2011 | 2,599 | 2,655 | 2,419 | 2,294 | 2,142 | 2,129 | 2,228 | 2,286 | 2,475 | 2,350 | 2,431 | 2,543 |
| 2012 | 2,659 | 2,614 | 2,568 | 2,605 | 2,552 | 2,601 | 2,479 | 2,562 | 2,324 | 2,224 | 2,461 | 2,717 |
| 2013 | 2,996 | 2,907 | 2,592 | 2,663 | 2,256 | 2,398 | 2,446 | 2,615 | 2,664 | 2,539 | 2,518 | 2,547 |
| 2014 | 2,669 | 2,494 | 2,528 | 2,405 | 2,582 | 2,395 | 2,371 | 2,542 | 2,789 | 2,623 | 2,513 | 3,017 |
| 2015 | 3,000 | 2,918 | 3,040 | 2,844 | 2,512 | 2,725 | 2,475 | 2,989 | 2,896 | 2,441 | 2,746 | 3,137 |
| 2016 | 3,054 | 3,282 | 3,030 | 2,630 | 2,573 | 2,373 | 2,393 | 2,846 | 2,920 | 2,683 | 3,104 | 3,269 |
| 2017 | 3,476 | 3,271 | 3,353 | 3,007 | 3,202 | 2,901 | 2,844 | 3,199 | 3,112 | 3,321 | 3,047 | 3,455 |
| 2018 | 3,445 | 3,129 | 3,236 | 3,162 | 3,305 | 3,490 | 3,046 | 3,306 | 3,073 | 3,170 | 3,508 | 3,340 |
| 2019 | 3,778 | 3,157 | 3,486 | 3,256 | 3,397 | 3,537 | 3,695 | 3,328 | 3,272 | 3,232 | 2,815 | 3,758 |
| 2020 | 3,219 | 3,378 | 3,368 | 3,233 | 2,989 | 2,938 | 3,077 | 3,006 | 2,898 | 3,095 | 3,413 | 3,702 |
| 2021 | 3,674 | 3,501 | 3,646 | 3,124 | 3,251 | 3,736 | 3,346 | 3,351 | 3,515 | 3,340 | 3,662 | 3,922 |
| 2022 | 3,819 | 3,704 | 3,853 | 3,370 | 3,440 | 3,286 | 3,435 | 3,506 | 3,583 | 3,439 | 3,444 | 3,368 |
| 2023 | 3,698 | 3,852 | 3,639 | 3,408 | 3,783 | 3,478 | 3,288 | 3,736 | 3,498 | 3,557 | 3,958 | 3,609 |
| 2024 | 3,949 | 3,993 | 3,571 | 3,672 | ||||||||
| - = No Data Reported; -- = Not Applicable; NA = Not Available; W = Withheld to avoid disclosure of individual company data. |
| Release Date: 6/28/2024 |
| Next Release Date: 7/31/2024 |