|
Download Data (XLS File) |
|
||||||||
|
||||||||
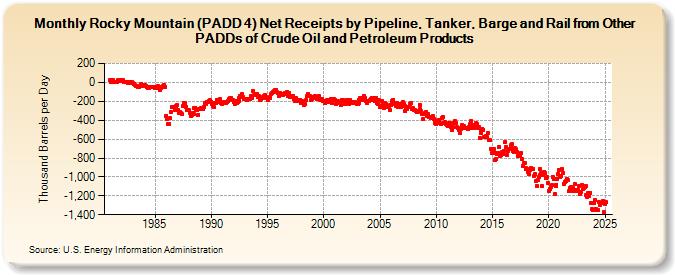
| Rocky Mountain (PADD 4) Net Receipts by Pipeline, Tanker, Barge and Rail from Other PADDs of Crude Oil and Petroleum Products (Thousand Barrels per Day) | ||||||||
| Year | Jan | Feb | Mar | Apr | May | Jun | Jul | Aug | Sep | Oct | Nov | Dec |
|---|---|---|---|---|---|---|---|---|---|---|---|---|
| 1981 | 21 | 6 | 25 | 25 | 7 | 6 | 5 | 2 | 21 | 30 | 16 | 18 |
| 1982 | 13 | 28 | 24 | 1 | 8 | 3 | -1 | -10 | -8 | 5 | -7 | 0 |
| 1983 | -9 | -14 | -12 | -31 | -38 | -36 | -45 | -44 | -35 | -16 | -40 | -23 |
| 1984 | -24 | -32 | -33 | -52 | -55 | -63 | -54 | -47 | -47 | -45 | -50 | -46 |
| 1985 | -56 | -47 | -60 | -43 | -57 | -78 | -55 | -44 | -42 | -30 | -37 | -47 |
| 1986 | -353 | -384 | -437 | -436 | -381 | -317 | -265 | -261 | -258 | -288 | -250 | -244 |
| 1987 | -295 | -318 | -327 | -316 | -329 | -338 | -254 | -220 | -223 | -256 | -296 | -294 |
| 1988 | -290 | -325 | -355 | -341 | -322 | -336 | -266 | -267 | -293 | -290 | -342 | -282 |
| 1989 | -278 | -274 | -275 | -278 | -257 | -216 | -232 | -204 | -204 | -200 | -197 | -190 |
| 1990 | -203 | -227 | -245 | -263 | -214 | -220 | -182 | -212 | -198 | -181 | -213 | -225 |
| 1991 | -214 | -203 | -219 | -214 | -214 | -207 | -193 | -181 | -170 | -164 | -183 | -186 |
| 1992 | -206 | -227 | -195 | -221 | -208 | -198 | -170 | -141 | -151 | -123 | -152 | -175 |
| 1993 | -176 | -178 | -188 | -179 | -176 | -181 | -149 | -166 | -88 | -138 | -138 | -123 |
| 1994 | -138 | -118 | -159 | -146 | -188 | -171 | -169 | -151 | -146 | -136 | -162 | -157 |
| 1995 | -191 | -168 | -162 | -161 | -124 | -112 | -100 | -96 | -81 | -76 | -104 | -113 |
| 1996 | -140 | -109 | -126 | -135 | -129 | -121 | -125 | -110 | -114 | -98 | -143 | -114 |
| 1997 | -151 | -144 | -141 | -143 | -181 | -194 | -169 | -200 | -196 | -189 | -183 | -186 |
| 1998 | -213 | -195 | -203 | -244 | -226 | -188 | -147 | -120 | -145 | -149 | -190 | -172 |
| 1999 | -156 | -159 | -157 | -146 | -166 | -175 | -160 | -147 | -182 | -186 | -181 | -200 |
| 2000 | -202 | -222 | -204 | -190 | -203 | -202 | -189 | -195 | -177 | -217 | -190 | -177 |
| 2001 | -183 | -227 | -209 | -201 | -206 | -213 | -239 | -188 | -185 | -202 | -227 | -223 |
| 2002 | -209 | -186 | -220 | -224 | -190 | -212 | -204 | -219 | -212 | -204 | -218 | -228 |
| 2003 | -231 | -182 | -220 | -162 | -177 | -185 | -161 | -139 | -161 | -194 | -221 | -198 |
| 2004 | -199 | -190 | -177 | -161 | -160 | -186 | -197 | -164 | -167 | -217 | -232 | -187 |
| 2005 | -258 | -253 | -195 | -225 | -270 | -221 | -225 | -246 | -256 | -252 | -289 | -243 |
| 2006 | -244 | -201 | -186 | -223 | -231 | -252 | -217 | -259 | -234 | -228 | -265 | -239 |
| 2007 | -211 | -226 | -248 | -298 | -270 | -282 | -258 | -264 | -224 | -223 | -277 | -272 |
| 2008 | -289 | -292 | -308 | -314 | -308 | -312 | -234 | -284 | -307 | -334 | -388 | -337 |
| 2009 | -328 | -309 | -359 | -336 | -362 | -371 | -374 | -366 | -360 | -389 | -395 | -427 |
| 2010 | -439 | -413 | -419 | -401 | -432 | -436 | -376 | -361 | -427 | -417 | -445 | -451 |
| 2011 | -461 | -434 | -465 | -427 | -467 | -501 | -473 | -429 | -411 | -427 | -473 | -478 |
| 2012 | -501 | -532 | -493 | -452 | -487 | -463 | -480 | -480 | -479 | -485 | -495 | -471 |
| 2013 | -441 | -405 | -487 | -453 | -487 | -446 | -432 | -438 | -487 | -468 | -587 | -509 |
| 2014 | -534 | -490 | -500 | -582 | -576 | -564 | -576 | -534 | -611 | -611 | -707 | -746 |
| 2015 | -752 | -706 | -822 | -751 | -814 | -761 | -748 | -683 | -782 | -764 | -741 | -753 |
| 2016 | -721 | -634 | -685 | -764 | -721 | -704 | -705 | -696 | -667 | -657 | -724 | -737 |
| 2017 | -695 | -705 | -735 | -775 | -777 | -780 | -749 | -811 | -887 | -853 | -856 | -902 |
| 2018 | -921 | -912 | -947 | -969 | -926 | -901 | -918 | -912 | -995 | -972 | -1,043 | -1,095 |
| 2019 | -1,031 | -1,005 | -915 | -979 | -958 | -1,097 | -980 | -945 | -958 | -1,015 | -1,002 | -1,062 |
| 2020 | -1,149 | -1,127 | -1,109 | -1,089 | -997 | -1,022 | -1,181 | -1,093 | -1,081 | -1,025 | -971 | -922 |
| 2021 | -1,001 | -988 | -918 | -956 | -1,072 | -1,059 | -1,043 | -1,022 | -1,038 | -1,154 | -1,119 | -1,148 |
| 2022 | -1,107 | -1,119 | -1,118 | -1,154 | -1,079 | -1,136 | -1,152 | -1,140 | -1,096 | -1,181 | -1,159 | -1,083 |
| 2023 | -1,130 | -1,120 | -1,107 | -1,095 | -1,188 | -1,214 | -1,167 | -1,200 | -1,166 | -1,272 | -1,342 | -1,353 |
| 2024 | -1,256 | |||||||||||
| - = No Data Reported; -- = Not Applicable; NA = Not Available; W = Withheld to avoid disclosure of individual company data. |
| Release Date: 3/29/2024 |
| Next Release Date: 4/30/2024 |