|
Download Data (XLS File) |
|
||||||||
|
||||||||
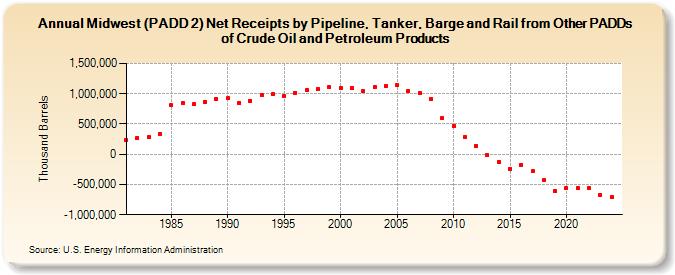
| Midwest (PADD 2) Net Receipts by Pipeline, Tanker, Barge and Rail from Other PADDs of Crude Oil and Petroleum Products (Thousand Barrels) | ||||||||
| Decade | Year-0 | Year-1 | Year-2 | Year-3 | Year-4 | Year-5 | Year-6 | Year-7 | Year-8 | Year-9 |
|---|---|---|---|---|---|---|---|---|---|---|
| 1980's | 235,769 | 266,069 | 280,100 | 341,030 | 808,372 | 846,106 | 822,776 | 859,404 | 912,478 | |
| 1990's | 924,767 | 854,483 | 886,680 | 985,636 | 990,362 | 954,792 | 1,015,619 | 1,058,080 | 1,078,519 | 1,106,918 |
| 2000's | 1,100,229 | 1,092,711 | 1,039,451 | 1,110,906 | 1,129,457 | 1,139,106 | 1,046,579 | 1,005,942 | 914,370 | 592,815 |
| 2010's | 474,584 | 284,770 | 142,733 | -15,695 | -126,577 | -238,166 | -170,012 | -285,317 | -432,152 | -611,394 |
| 2020's | -564,260 | -556,644 | -554,264 | -666,109 |
| - = No Data Reported; -- = Not Applicable; NA = Not Available; W = Withheld to avoid disclosure of individual company data. |
| Release Date: 3/29/2024 |
| Next Release Date: 8/30/2024 |