|
Download Data (XLS File) |
|
||||||||
|
||||||||
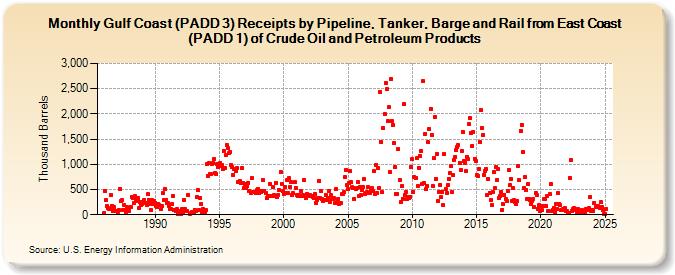
| Gulf Coast (PADD 3) Receipts by Pipeline, Tanker, Barge and Rail from East Coast (PADD 1) of Crude Oil and Petroleum Products (Thousand Barrels) | ||||||||
| Year | Jan | Feb | Mar | Apr | May | Jun | Jul | Aug | Sep | Oct | Nov | Dec |
|---|---|---|---|---|---|---|---|---|---|---|---|---|
| 1986 | 33 | 469 | 284 | 165 | 132 | 106 | 117 | 397 | 181 | 65 | 148 | 69 |
| 1987 | 77 | 59 | 98 | 516 | 263 | 286 | 92 | 194 | 87 | 62 | 147 | 99 |
| 1988 | 79 | 151 | 354 | 333 | 225 | 364 | 279 | 314 | 339 | 131 | 252 | 183 |
| 1989 | 216 | 261 | 296 | 229 | 189 | 403 | 299 | 221 | 85 | 296 | 210 | 279 |
| 1990 | 242 | 172 | 152 | 213 | 196 | 104 | 180 | 428 | 286 | 502 | 298 | 242 |
| 1991 | 223 | 181 | 105 | 104 | 205 | 371 | 100 | 71 | 109 | 9 | 66 | 48 |
| 1992 | 10 | 105 | 26 | 296 | 104 | 64 | 66 | 392 | 20 | 25 | 45 | 27 |
| 1993 | 28 | 101 | 77 | 354 | 489 | 87 | 339 | 210 | 28 | 113 | 43 | 95 |
| 1994 | 997 | 770 | 1,025 | 804 | 814 | 1,000 | 1,030 | 1,101 | 837 | 806 | 1,005 | 956 |
| 1995 | 1,018 | 972 | 993 | 912 | 1,273 | 928 | 1,175 | 1,379 | 1,330 | 1,217 | 1,242 | 983 |
| 1996 | 956 | 796 | 899 | 872 | 920 | 648 | 644 | 669 | 625 | 931 | 626 | 536 |
| 1997 | 601 | 533 | 575 | 636 | 468 | 432 | 725 | 458 | 453 | 455 | 421 | 481 |
| 1998 | 509 | 428 | 467 | 448 | 479 | 679 | 479 | 424 | 325 | 369 | 379 | 616 |
| 1999 | 380 | 369 | 545 | 383 | 376 | 638 | 343 | 393 | 490 | 846 | 614 | 461 |
| 2000 | 416 | 551 | 439 | 692 | 432 | 720 | 552 | 640 | 387 | 425 | 643 | 539 |
| 2001 | 390 | 376 | 385 | 375 | 469 | 365 | 383 | 687 | 377 | 330 | 413 | 368 |
| 2002 | 388 | 369 | 379 | 354 | 325 | 409 | 238 | 301 | 338 | 669 | 322 | 469 |
| 2003 | 316 | 278 | 291 | 384 | 297 | 325 | 474 | 244 | 388 | 307 | 309 | 324 |
| 2004 | 235 | 514 | 253 | 317 | 213 | 241 | 402 | 419 | 441 | 746 | 889 | 580 |
| 2005 | 505 | 638 | 859 | 640 | 542 | 537 | 311 | 514 | 526 | 640 | 368 | 547 |
| 2006 | 388 | 490 | 547 | 707 | 420 | 437 | 445 | 548 | 434 | 486 | 524 | 465 |
| 2007 | 862 | 414 | 995 | 436 | 932 | 539 | 2,431 | 1,445 | 445 | 1,711 | 1,997 | 2,615 |
| 2008 | 2,493 | 1,856 | 2,127 | 847 | 2,697 | 1,852 | 1,781 | 1,428 | 937 | 420 | 408 | 1,303 |
| 2009 | 692 | 250 | 560 | 321 | 2,189 | 392 | 449 | 311 | 349 | 331 | 360 | 941 |
| 2010 | 1,096 | 454 | 753 | 727 | 1,120 | 577 | 934 | 1,170 | 1,257 | 604 | 2,647 | 626 |
| 2011 | 1,611 | 501 | 569 | 1,436 | 1,696 | 2,098 | 1,583 | 570 | 1,118 | 1,946 | 714 | 1,208 |
| 2012 | 274 | 454 | 592 | 344 | 455 | 183 | 1,199 | 502 | 437 | 590 | 713 | 825 |
| 2013 | 959 | 448 | 786 | 1,087 | 1,153 | 1,281 | 1,343 | 1,375 | 1,033 | 885 | 1,263 | 1,641 |
| 2014 | 1,072 | 1,032 | 864 | 1,154 | 1,096 | 1,793 | 1,920 | 1,630 | 1,371 | 1,638 | 1,112 | 1,069 |
| 2015 | 778 | 770 | 904 | 1,449 | 2,076 | 1,727 | 1,585 | 795 | 875 | 904 | 398 | 707 |
| 2016 | 439 | 290 | 189 | 452 | 845 | 526 | 938 | 692 | 902 | 333 | 364 | 452 |
| 2017 | 101 | 204 | 400 | 315 | 275 | 466 | 888 | 581 | 711 | 273 | 524 | 290 |
| 2018 | 256 | 216 | 279 | 969 | 683 | 1,667 | 1,783 | 1,240 | 530 | 739 | 493 | 308 |
| 2019 | 602 | 320 | 295 | 216 | 273 | 309 | 144 | 438 | 384 | 119 | 187 | 68 |
| 2020 | 169 | 85 | 165 | 310 | 309 | 178 | 373 | 80 | 409 | 602 | 67 | 102 |
| 2021 | 141 | 44 | 209 | 111 | 434 | 215 | 191 | 86 | 84 | 107 | 132 | 75 |
| 2022 | 65 | 31 | 43 | 738 | 1,078 | 82 | 107 | 133 | 107 | 88 | 58 | 108 |
| 2023 | 79 | 40 | 88 | 78 | 58 | 39 | 113 | 102 | 111 | 127 | 348 | 81 |
| 2024 | 84 | |||||||||||
| - = No Data Reported; -- = Not Applicable; NA = Not Available; W = Withheld to avoid disclosure of individual company data. |
| Release Date: 3/29/2024 |
| Next Release Date: 4/30/2024 |