|
Download Data (XLS File) |
|
||||||||
|
||||||||
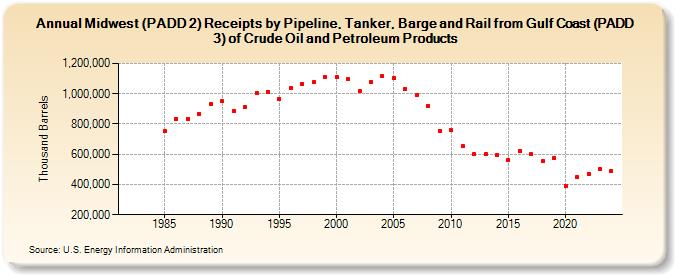
| Midwest (PADD 2) Receipts by Pipeline, Tanker, Barge and Rail from Gulf Coast (PADD 3) of Crude Oil and Petroleum Products (Thousand Barrels) | ||||||||
| Decade | Year-0 | Year-1 | Year-2 | Year-3 | Year-4 | Year-5 | Year-6 | Year-7 | Year-8 | Year-9 |
|---|---|---|---|---|---|---|---|---|---|---|
| 1980's | NA | NA | NA | NA | 752,410 | 836,107 | 835,772 | 866,201 | 929,550 | |
| 1990's | 949,486 | 884,657 | 912,712 | 1,006,080 | 1,013,702 | 968,355 | 1,038,820 | 1,064,722 | 1,077,246 | 1,111,148 |
| 2000's | 1,107,797 | 1,094,243 | 1,016,208 | 1,076,354 | 1,114,782 | 1,102,828 | 1,030,423 | 991,821 | 920,637 | 754,372 |
| 2010's | 758,264 | 651,057 | 599,472 | 600,325 | 592,588 | 560,312 | 618,192 | 598,576 | 553,218 | 578,083 |
| 2020's | 391,374 | 448,006 | 468,132 | 499,887 |
| - = No Data Reported; -- = Not Applicable; NA = Not Available; W = Withheld to avoid disclosure of individual company data. |
| Release Date: 8/30/2024 |
| Next Release Date: 8/29/2025 |