|
Download Data (XLS File) |
|
||||||||
|
||||||||
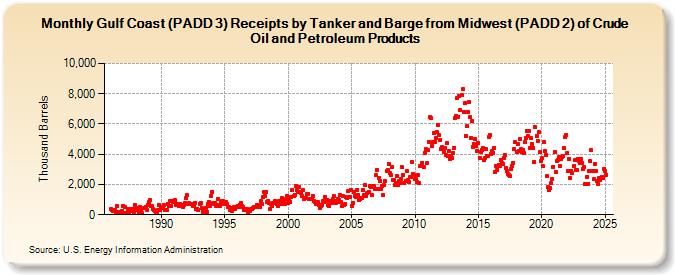
| Gulf Coast (PADD 3) Receipts by Tanker and Barge from Midwest (PADD 2) of Crude Oil and Petroleum Products (Thousand Barrels) | ||||||||
| Year | Jan | Feb | Mar | Apr | May | Jun | Jul | Aug | Sep | Oct | Nov | Dec |
|---|---|---|---|---|---|---|---|---|---|---|---|---|
| 1986 | 366 | 307 | 256 | 333 | 339 | 111 | 574 | 209 | 199 | 205 | 168 | 249 |
| 1987 | 577 | 532 | 94 | 126 | 370 | 207 | 244 | 397 | 390 | 404 | 189 | 634 |
| 1988 | 289 | 461 | 311 | 184 | 527 | 338 | 82 | 449 | 462 | 516 | 341 | 612 |
| 1989 | 846 | 971 | 565 | 553 | 360 | 297 | 231 | 204 | 171 | 306 | 669 | 300 |
| 1990 | 517 | 431 | 643 | 333 | 318 | 286 | 739 | 588 | 882 | 573 | 893 | 824 |
| 1991 | 853 | 944 | 629 | 739 | 701 | 580 | 728 | 662 | 498 | 615 | 793 | 1,097 |
| 1992 | 1,283 | 680 | 756 | 710 | 733 | 719 | 556 | 561 | 806 | 347 | 395 | 319 |
| 1993 | 741 | 749 | 434 | 191 | 351 | 379 | 465 | 151 | 720 | 843 | 586 | 1,226 |
| 1994 | 1,508 | 750 | 723 | 752 | 589 | 621 | 1,059 | 576 | 798 | 887 | 910 | 731 |
| 1995 | 704 | 844 | 677 | 512 | 531 | 329 | 467 | 249 | 377 | 520 | 382 | 484 |
| 1996 | 605 | 481 | 670 | 762 | 563 | 526 | 294 | 342 | 409 | 366 | 112 | 263 |
| 1997 | 214 | 409 | 377 | 473 | 522 | 512 | 626 | 625 | 504 | 497 | 894 | 701 |
| 1998 | 1,163 | 1,520 | 1,233 | 1,471 | 828 | 909 | 756 | 385 | 721 | 554 | 780 | 909 |
| 1999 | 797 | 718 | 599 | 901 | 893 | 686 | 1,101 | 850 | 956 | 715 | 1,033 | 1,240 |
| 2000 | 785 | 955 | 854 | 1,203 | 1,645 | 1,244 | 1,335 | 1,870 | 1,640 | 1,514 | 1,827 | 1,522 |
| 2001 | 1,433 | 1,225 | 1,607 | 1,057 | 1,135 | 1,100 | 1,368 | 1,394 | 1,024 | 1,048 | 1,038 | 1,270 |
| 2002 | 886 | 828 | 721 | 719 | 836 | 616 | 438 | 579 | 647 | 925 | 851 | 1,204 |
| 2003 | 880 | 977 | 649 | 563 | 911 | 782 | 1,009 | 1,221 | 934 | 806 | 816 | 1,049 |
| 2004 | 981 | 1,287 | 815 | 565 | 1,208 | 615 | 717 | 1,183 | 1,085 | 1,594 | 1,177 | 1,664 |
| 2005 | 590 | 782 | 1,501 | 1,237 | 1,156 | 1,651 | 1,319 | 964 | 1,028 | 1,092 | 1,135 | 1,663 |
| 2006 | 1,273 | 1,943 | 1,239 | 1,403 | 1,527 | 1,891 | 1,804 | 1,291 | 1,926 | 1,894 | 1,694 | 2,602 |
| 2007 | 2,974 | 1,726 | 2,457 | 2,217 | 1,721 | 1,882 | 1,275 | 1,938 | 2,228 | 2,889 | 2,938 | 3,336 |
| 2008 | 2,726 | 2,598 | 3,140 | 2,316 | 2,305 | 1,939 | 2,086 | 2,545 | 1,964 | 2,228 | 2,127 | 2,385 |
| 2009 | 3,122 | 2,635 | 2,077 | 2,219 | 2,890 | 2,285 | 2,142 | 2,472 | 2,480 | 3,516 | 2,719 | 2,616 |
| 2010 | 2,340 | 2,344 | 2,140 | 2,624 | 2,128 | 3,222 | 3,231 | 3,432 | 3,151 | 4,098 | 4,329 | 3,391 |
| 2011 | 4,264 | 4,818 | 6,434 | 6,400 | 4,564 | 4,805 | 5,425 | 4,819 | 5,046 | 5,449 | 5,949 | 5,267 |
| 2012 | 4,958 | 4,354 | 4,479 | 4,159 | 4,420 | 3,929 | 4,750 | 3,869 | 4,194 | 3,709 | 3,896 | 3,738 |
| 2013 | 4,089 | 4,430 | 6,404 | 6,556 | 7,705 | 6,482 | 7,833 | 6,926 | 7,896 | 8,292 | 6,816 | 7,358 |
| 2014 | 5,226 | 5,847 | 6,790 | 7,458 | 6,456 | 5,081 | 6,173 | 4,491 | 4,680 | 4,982 | 4,533 | 4,222 |
| 2015 | 4,744 | 3,747 | 4,145 | 4,308 | 4,427 | 3,601 | 3,745 | 4,359 | 3,871 | 3,878 | 5,168 | 5,260 |
| 2016 | 4,019 | 4,209 | 4,096 | 4,431 | 2,795 | 3,232 | 2,981 | 3,304 | 3,200 | 3,617 | 3,433 | 3,378 |
| 2017 | 3,771 | 3,953 | 3,119 | 2,895 | 2,696 | 2,635 | 2,532 | 3,004 | 3,216 | 3,449 | 4,332 | 4,788 |
| 2018 | 4,114 | 4,695 | 4,222 | 4,995 | 4,313 | 4,133 | 4,306 | 4,090 | 4,805 | 5,101 | 5,554 | 5,195 |
| 2019 | 5,543 | 4,422 | 5,048 | 4,687 | 4,417 | 3,504 | 5,767 | 5,194 | 4,882 | 5,441 | 4,115 | 3,557 |
| 2020 | 3,724 | 3,190 | 4,798 | 4,204 | 3,980 | 2,577 | 1,838 | 1,606 | 1,763 | 2,075 | 2,387 | 3,174 |
| 2021 | 4,149 | 2,852 | 3,542 | 3,626 | 3,790 | 3,244 | 3,658 | 3,840 | 3,907 | 4,382 | 5,118 | 5,289 |
| 2022 | 4,106 | 2,878 | 3,694 | 2,452 | 2,896 | 2,741 | 3,205 | 3,595 | 2,947 | 2,989 | 3,684 | 3,550 |
| 2023 | 3,446 | 3,709 | 3,447 | 3,050 | 3,060 | 2,016 | 2,013 | 2,503 | 2,052 | 2,923 | 3,519 | 4,256 |
| 2024 | 2,909 | 2,340 | 3,383 | 2,896 | ||||||||
| - = No Data Reported; -- = Not Applicable; NA = Not Available; W = Withheld to avoid disclosure of individual company data. |
| Release Date: 6/28/2024 |
| Next Release Date: 7/31/2024 |