|
Download Data (XLS File) |
|
||||||||
|
||||||||
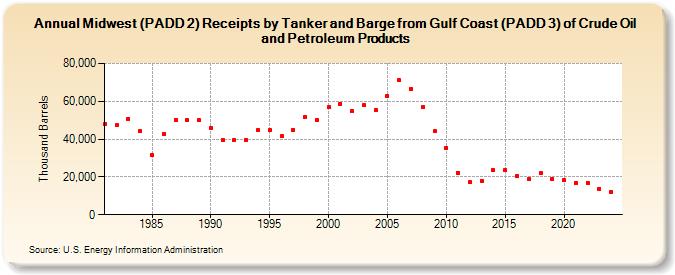
| Midwest (PADD 2) Receipts by Tanker and Barge from Gulf Coast (PADD 3) of Crude Oil and Petroleum Products (Thousand Barrels) | ||||||||
| Decade | Year-0 | Year-1 | Year-2 | Year-3 | Year-4 | Year-5 | Year-6 | Year-7 | Year-8 | Year-9 |
|---|---|---|---|---|---|---|---|---|---|---|
| 1980's | 47,773 | 47,271 | 50,667 | 44,225 | 31,395 | 42,834 | 50,187 | 49,887 | 49,955 | |
| 1990's | 46,024 | 39,393 | 39,279 | 39,556 | 44,551 | 44,553 | 41,508 | 44,977 | 51,606 | 50,036 |
| 2000's | 56,806 | 58,826 | 54,814 | 58,009 | 55,321 | 62,665 | 71,087 | 66,687 | 56,947 | 44,067 |
| 2010's | 35,530 | 22,287 | 17,098 | 18,044 | 23,504 | 23,535 | 20,456 | 18,681 | 21,900 | 19,012 |
| 2020's | 18,137 | 16,769 | 17,029 | 13,769 |
| - = No Data Reported; -- = Not Applicable; NA = Not Available; W = Withheld to avoid disclosure of individual company data. |
| Release Date: 8/30/2024 |
| Next Release Date: 8/29/2025 |