|
Download Data (XLS File) |
|
||||||||
|
||||||||
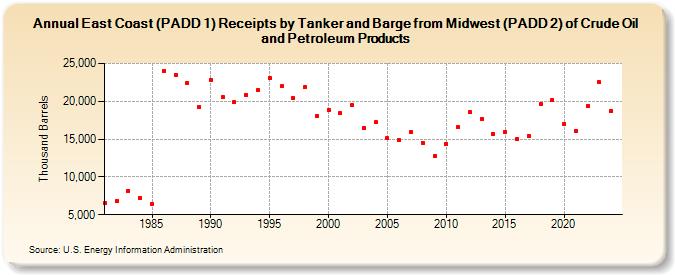
| East Coast (PADD 1) Receipts by Tanker and Barge from Midwest (PADD 2) of Crude Oil and Petroleum Products (Thousand Barrels) | ||||||||
| Decade | Year-0 | Year-1 | Year-2 | Year-3 | Year-4 | Year-5 | Year-6 | Year-7 | Year-8 | Year-9 |
|---|---|---|---|---|---|---|---|---|---|---|
| 1980's | 6,489 | 6,842 | 8,163 | 7,242 | 6,428 | 24,065 | 23,541 | 22,477 | 19,262 | |
| 1990's | 22,839 | 20,562 | 19,904 | 20,837 | 21,488 | 23,064 | 21,964 | 20,416 | 21,840 | 18,029 |
| 2000's | 18,851 | 18,416 | 19,507 | 16,481 | 17,213 | 15,085 | 14,851 | 15,924 | 14,520 | 12,745 |
| 2010's | 14,380 | 16,587 | 18,562 | 17,658 | 15,694 | 15,938 | 15,022 | 15,462 | 19,604 | 20,151 |
| 2020's | 16,951 | 16,060 | 19,372 | 22,499 |
| - = No Data Reported; -- = Not Applicable; NA = Not Available; W = Withheld to avoid disclosure of individual company data. |
| Release Date: 8/30/2024 |
| Next Release Date: 8/29/2025 |