|
Download Data (XLS File) |
|
||||||||
|
||||||||
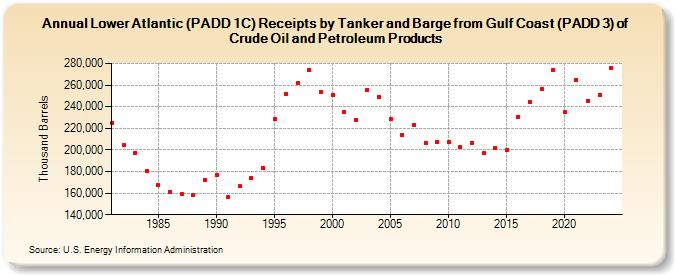
| Lower Atlantic (PADD 1C) Receipts by Tanker and Barge from Gulf Coast (PADD 3) of Crude Oil and Petroleum Products (Thousand Barrels) | ||||||||
| Decade | Year-0 | Year-1 | Year-2 | Year-3 | Year-4 | Year-5 | Year-6 | Year-7 | Year-8 | Year-9 |
|---|---|---|---|---|---|---|---|---|---|---|
| 1980's | 225,145 | 204,644 | 197,153 | 180,830 | 167,075 | 161,479 | 159,320 | 158,108 | 172,215 | |
| 1990's | 177,227 | 156,134 | 166,803 | 174,265 | 183,160 | 228,276 | 252,055 | 262,292 | 274,266 | 253,371 |
| 2000's | 251,184 | 234,856 | 228,029 | 255,828 | 249,391 | 229,066 | 213,594 | 223,047 | 206,664 | 207,437 |
| 2010's | 207,112 | 202,783 | 206,560 | 196,919 | 201,459 | 199,734 | 230,620 | 244,598 | 256,458 | 274,272 |
| 2020's | 234,832 | 264,860 | 245,537 | 251,138 |
| - = No Data Reported; -- = Not Applicable; NA = Not Available; W = Withheld to avoid disclosure of individual company data. |
| Release Date: 3/29/2024 |
| Next Release Date: 8/30/2024 |