|
Download Data (XLS File) |
|
||||||||
|
||||||||
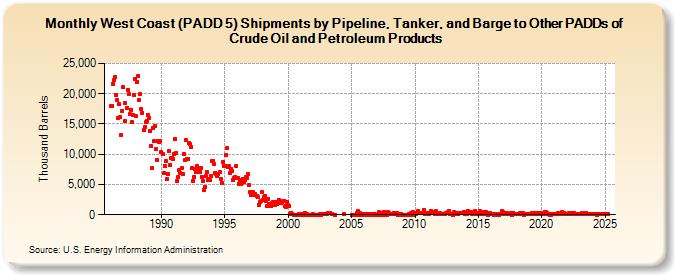
| West Coast (PADD 5) Shipments by Pipeline, Tanker, and Barge to Other PADDs of Crude Oil and Petroleum Products (Thousand Barrels) | ||||||||
| Year | Jan | Feb | Mar | Apr | May | Jun | Jul | Aug | Sep | Oct | Nov | Dec |
|---|---|---|---|---|---|---|---|---|---|---|---|---|
| 1986 | 17,914 | 18,013 | 21,613 | 22,211 | 22,755 | 19,868 | 18,987 | 15,976 | 18,240 | 16,126 | 13,199 | 17,160 |
| 1987 | 21,053 | 15,439 | 18,393 | 17,685 | 20,616 | 19,905 | 16,627 | 17,355 | 15,255 | 16,483 | 19,819 | 22,512 |
| 1988 | 16,289 | 21,982 | 22,881 | 18,951 | 19,924 | 17,421 | 16,868 | 13,992 | 14,429 | 15,283 | 15,572 | 16,557 |
| 1989 | 15,968 | 13,860 | 11,359 | 7,657 | 14,307 | 12,126 | 14,662 | 10,809 | 9,094 | 12,261 | 11,975 | 12,203 |
| 1990 | 10,313 | 9,978 | 6,859 | 8,036 | 8,813 | 5,867 | 6,765 | 10,537 | 8,173 | 9,441 | 9,427 | 9,163 |
| 1991 | 10,024 | 12,521 | 10,266 | 5,508 | 6,263 | 7,319 | 6,845 | 7,745 | 6,751 | 10,099 | 8,973 | 12,330 |
| 1992 | 9,196 | 9,268 | 11,882 | 11,613 | 11,152 | 7,741 | 5,599 | 6,315 | 7,549 | 6,980 | 7,998 | 7,422 |
| 1993 | 7,086 | 7,735 | 6,305 | 5,510 | 4,025 | 4,663 | 6,464 | 7,033 | 5,669 | 5,953 | 5,737 | 6,382 |
| 1994 | 8,898 | 8,841 | 8,376 | 6,952 | 6,744 | 6,327 | 6,724 | 7,030 | 5,983 | 5,239 | 8,783 | 8,097 |
| 1995 | 8,099 | 9,827 | 10,951 | 7,956 | 8,006 | 6,888 | 7,631 | 7,224 | 5,738 | 6,110 | 6,243 | 8,027 |
| 1996 | 6,133 | 5,113 | 5,821 | 5,081 | 5,286 | 5,932 | 5,337 | 5,777 | 6,225 | 6,031 | 6,693 | 4,918 |
| 1997 | 3,792 | 3,244 | 3,587 | 3,680 | 3,322 | 3,425 | 3,032 | 2,863 | 1,667 | 2,096 | 2,285 | 3,832 |
| 1998 | 2,428 | 2,920 | 3,137 | 2,195 | 1,488 | 2,631 | 1,729 | 1,499 | 1,404 | 1,968 | 2,137 | 1,577 |
| 1999 | 2,046 | 1,777 | 2,116 | 2,466 | 1,951 | 1,962 | 2,029 | 2,224 | 2,343 | 1,429 | 1,271 | 2,044 |
| 2000 | 1,567 | 1,422 | 161 | 338 | 90 | 0 | 28 | 0 | 10 | 30 | 38 | 55 |
| 2001 | 0 | 0 | 65 | 0 | 260 | 0 | 43 | 0 | 0 | 0 | 33 | 58 |
| 2002 | 0 | 0 | 0 | 0 | 0 | 0 | 61 | 0 | 48 | 99 | 43 | 100 |
| 2003 | 100 | 183 | 225 | 202 | 269 | 164 | 25 | |||||
| 2004 | 112 | |||||||||||
| 2005 | 0 | 0 | 0 | 0 | 0 | 230 | 559 | 0 | 314 | 148 | 0 | 57 |
| 2006 | 59 | 0 | 171 | 0 | 140 | 1 | 149 | 0 | 41 | 0 | 38 | 0 |
| 2007 | 0 | 0 | 382 | 0 | 250 | 325 | 21 | 459 | 0 | 0 | 449 | 256 |
| 2008 | 57 | 95 | 65 | 60 | 365 | 242 | 62 | 210 | 0 | 165 | 0 | 123 |
| 2009 | 0 | 3 | 0 | 0 | 0 | 0 | 97 | 0 | 205 | 355 | 443 | 0 |
| 2010 | 267 | 115 | 319 | 672 | 233 | 299 | 295 | 204 | 769 | 180 | 50 | 228 |
| 2011 | 49 | 199 | 326 | 628 | 217 | 395 | 234 | 196 | 567 | 49 | 200 | 74 |
| 2012 | 283 | 50 | 148 | 182 | 125 | 208 | 265 | 405 | 667 | 70 | 73 | 74 |
| 2013 | 0 | 368 | 75 | 272 | 139 | 47 | 260 | 296 | 356 | 225 | 396 | 89 |
| 2014 | 211 | 110 | 614 | 384 | 211 | 393 | 128 | 307 | 95 | 595 | 85 | 221 |
| 2015 | 84 | 605 | 162 | 279 | 150 | 396 | 204 | 420 | 106 | 31 | 65 | 279 |
| 2016 | 196 | 46 | 135 | 30 | 29 | 121 | 4 | 6 | 122 | 80 | 556 | 431 |
| 2017 | 170 | 287 | 245 | 261 | 49 | 90 | 71 | 227 | 25 | 352 | 91 | 115 |
| 2018 | 140 | 179 | 196 | 208 | 145 | 125 | 303 | 25 | 161 | 162 | 99 | 45 |
| 2019 | 70 | 66 | 162 | 257 | 265 | 96 | 221 | 50 | 213 | 75 | 75 | 206 |
| 2020 | 148 | 136 | 128 | 383 | 405 | 266 | 89 | 50 | 19 | 0 | 50 | 53 |
| 2021 | 158 | 177 | 75 | 217 | 102 | 98 | 81 | 372 | 127 | 278 | 51 | 103 |
| 2022 | 137 | 73 | 220 | 181 | 190 | 214 | 247 | 136 | 133 | 90 | 141 | 173 |
| 2023 | 146 | 89 | 221 | 325 | 127 | 115 | 323 | 119 | 78 | 167 | 37 | 187 |
| 2024 | 66 | |||||||||||
| - = No Data Reported; -- = Not Applicable; NA = Not Available; W = Withheld to avoid disclosure of individual company data. |
| Release Date: 3/29/2024 |
| Next Release Date: 4/30/2024 |
Referring Pages: