|
Download Data (XLS File) |
|
||||||||
|
||||||||
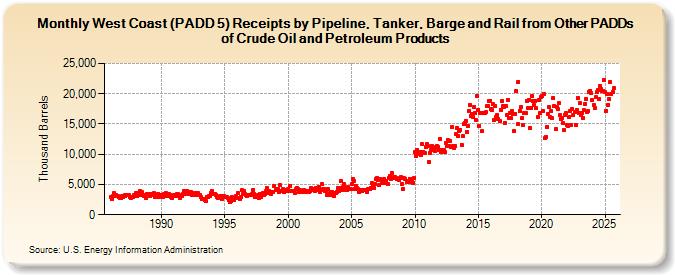
| West Coast (PADD 5) Receipts by Pipeline, Tanker, Barge and Rail from Other PADDs of Crude Oil and Petroleum Products (Thousand Barrels) | ||||||||
| Year | Jan | Feb | Mar | Apr | May | Jun | Jul | Aug | Sep | Oct | Nov | Dec |
|---|---|---|---|---|---|---|---|---|---|---|---|---|
| 1986 | 2,951 | 2,529 | 3,013 | 3,550 | 3,117 | 3,252 | 3,084 | 3,030 | 2,890 | 2,760 | 2,701 | 3,114 |
| 1987 | 2,935 | 3,047 | 3,198 | 3,307 | 3,323 | 3,252 | 2,939 | 2,811 | 2,942 | 2,908 | 3,208 | 3,066 |
| 1988 | 3,556 | 3,080 | 3,568 | 3,302 | 3,878 | 3,204 | 3,699 | 3,082 | 3,196 | 2,775 | 3,385 | 3,381 |
| 1989 | 3,412 | 3,050 | 3,484 | 3,374 | 3,219 | 3,556 | 2,874 | 3,050 | 2,876 | 3,486 | 2,981 | 3,225 |
| 1990 | 3,205 | 2,896 | 3,357 | 3,096 | 3,519 | 3,275 | 3,168 | 3,361 | 3,314 | 2,912 | 2,702 | 3,150 |
| 1991 | 3,262 | 3,165 | 3,077 | 3,378 | 3,409 | 3,183 | 2,818 | 3,017 | 3,426 | 3,845 | 3,429 | 3,820 |
| 1992 | 3,989 | 3,816 | 3,489 | 3,609 | 3,781 | 3,277 | 3,598 | 3,599 | 3,187 | 3,565 | 3,281 | 3,527 |
| 1993 | 3,303 | 2,960 | 2,621 | 2,551 | 2,641 | 2,364 | 2,239 | 2,973 | 2,888 | 3,030 | 3,170 | 3,672 |
| 1994 | 3,899 | 3,381 | 3,400 | 3,426 | 3,332 | 2,934 | 2,811 | 3,043 | 3,032 | 2,518 | 3,064 | 3,086 |
| 1995 | 3,002 | 3,010 | 2,878 | 2,762 | 2,366 | 2,132 | 2,240 | 2,871 | 2,735 | 2,373 | 2,734 | 3,024 |
| 1996 | 3,549 | 2,804 | 2,602 | 2,897 | 4,055 | 3,463 | 3,902 | 3,444 | 3,272 | 3,029 | 3,259 | 3,180 |
| 1997 | 3,213 | 3,269 | 3,439 | 4,060 | 3,427 | 2,959 | 3,008 | 3,236 | 2,738 | 3,402 | 2,900 | 3,269 |
| 1998 | 3,545 | 3,315 | 3,383 | 3,924 | 4,362 | 3,530 | 3,851 | 3,706 | 3,485 | 3,679 | 3,758 | 4,675 |
| 1999 | 4,153 | 4,273 | 4,292 | 3,678 | 4,942 | 3,997 | 3,984 | 4,187 | 3,804 | 3,917 | 4,089 | 3,884 |
| 2000 | 4,232 | 3,887 | 4,825 | 3,838 | 3,978 | 3,910 | 3,646 | 4,257 | 4,398 | 4,301 | 3,809 | 4,059 |
| 2001 | 3,806 | 3,777 | 3,788 | 4,122 | 3,769 | 3,749 | 3,872 | 3,918 | 3,741 | 3,865 | 4,395 | 4,080 |
| 2002 | 4,323 | 3,930 | 4,354 | 4,094 | 4,004 | 4,598 | 3,748 | 4,086 | 5,009 | 4,333 | 4,277 | 3,985 |
| 2003 | 3,849 | 3,327 | 4,195 | 3,296 | 3,598 | 3,823 | 3,246 | 3,103 | 3,521 | 3,531 | 3,796 | 4,447 |
| 2004 | 3,919 | 4,400 | 5,577 | 4,143 | 4,657 | 5,017 | 4,366 | 4,036 | 4,063 | 4,504 | 4,330 | 4,236 |
| 2005 | 5,082 | 5,847 | 5,529 | 4,259 | 4,819 | 4,408 | 4,194 | 3,724 | 4,039 | 4,076 | 3,873 | 4,107 |
| 2006 | 4,082 | 4,160 | 4,129 | 3,749 | 4,251 | 4,199 | 4,478 | 5,189 | 4,793 | 4,461 | 5,155 | 5,896 |
| 2007 | 6,097 | 5,668 | 4,888 | 5,826 | 5,783 | 5,175 | 5,284 | 5,925 | 5,276 | 5,624 | 5,112 | 6,063 |
| 2008 | 6,386 | 5,982 | 6,951 | 6,097 | 6,222 | 6,229 | 6,125 | 5,887 | 5,867 | 5,712 | 6,042 | 6,157 |
| 2009 | 5,122 | 4,276 | 6,010 | 5,982 | 5,413 | 5,631 | 5,462 | 5,964 | 5,730 | 5,853 | 5,325 | 6,064 |
| 2010 | 10,323 | 9,764 | 10,716 | 10,043 | 10,106 | 10,428 | 9,838 | 11,612 | 10,414 | 10,191 | 11,188 | 11,621 |
| 2011 | 11,366 | 8,674 | 10,205 | 10,697 | 11,329 | 10,810 | 10,661 | 10,523 | 11,174 | 11,367 | 11,237 | 10,739 |
| 2012 | 12,537 | 10,373 | 10,663 | 10,755 | 10,376 | 11,824 | 11,279 | 12,361 | 11,395 | 12,246 | 11,150 | 14,524 |
| 2013 | 11,331 | 11,097 | 11,287 | 13,360 | 14,337 | 13,062 | 13,877 | 14,048 | 11,598 | 12,956 | 14,940 | 15,186 |
| 2014 | 15,567 | 13,639 | 14,658 | 17,221 | 18,176 | 16,359 | 16,660 | 16,189 | 17,868 | 16,815 | 15,632 | 19,603 |
| 2015 | 17,371 | 14,671 | 16,887 | 13,786 | 16,877 | 16,826 | 16,882 | 16,913 | 17,892 | 17,933 | 18,720 | 18,873 |
| 2016 | 17,529 | 17,304 | 18,273 | 15,696 | 17,964 | 16,167 | 16,530 | 15,897 | 15,438 | 17,380 | 18,759 | 17,954 |
| 2017 | 17,765 | 15,205 | 17,945 | 16,491 | 18,989 | 16,055 | 16,885 | 15,916 | 17,067 | 16,600 | 13,836 | 16,729 |
| 2018 | 20,435 | 14,956 | 21,989 | 17,167 | 17,744 | 15,959 | 14,764 | 16,846 | 16,756 | 16,736 | 18,844 | 17,582 |
| 2019 | 19,010 | 14,351 | 17,674 | 19,622 | 18,877 | 18,115 | 18,798 | 17,567 | 16,107 | 18,940 | 16,781 | 19,406 |
| 2020 | 19,688 | 17,183 | 20,001 | 12,603 | 12,882 | 14,581 | 16,728 | 17,738 | 16,078 | 17,078 | 15,929 | 19,294 |
| 2021 | 17,972 | 14,155 | 17,839 | 17,536 | 18,398 | 16,463 | 15,806 | 16,009 | 15,152 | 14,015 | 16,482 | 16,808 |
| 2022 | 14,913 | 14,677 | 16,235 | 17,075 | 14,882 | 17,473 | 16,410 | 16,924 | 14,773 | 17,361 | 19,342 | 16,789 |
| 2023 | 18,433 | 16,411 | 16,717 | 16,004 | 17,251 | 18,367 | 19,184 | 16,965 | 16,468 | 21,393 | 20,490 | 20,025 |
| 2024 | 18,529 | |||||||||||
| - = No Data Reported; -- = Not Applicable; NA = Not Available; W = Withheld to avoid disclosure of individual company data. |
| Release Date: 3/29/2024 |
| Next Release Date: 4/30/2024 |
Referring Pages: