|
Download Data (XLS File) |
|
||||||||
|
||||||||
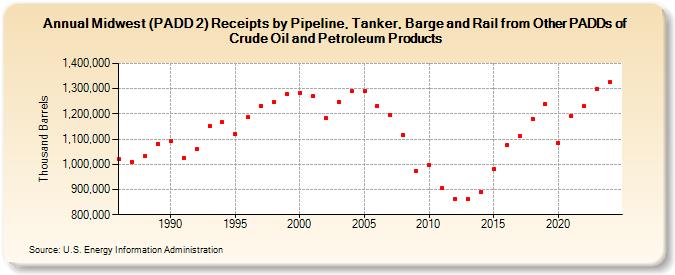
| Midwest (PADD 2) Receipts by Pipeline, Tanker, Barge and Rail from Other PADDs of Crude Oil and Petroleum Products (Thousand Barrels) | ||||||||
| Decade | Year-0 | Year-1 | Year-2 | Year-3 | Year-4 | Year-5 | Year-6 | Year-7 | Year-8 | Year-9 |
|---|---|---|---|---|---|---|---|---|---|---|
| 1980's | 1,019,346 | 1,008,028 | 1,032,304 | 1,081,772 | ||||||
| 1990's | 1,092,254 | 1,026,982 | 1,058,769 | 1,152,548 | 1,166,761 | 1,118,773 | 1,186,197 | 1,230,342 | 1,248,908 | 1,279,236 |
| 2000's | 1,283,884 | 1,269,541 | 1,181,905 | 1,246,791 | 1,289,293 | 1,289,296 | 1,230,560 | 1,194,869 | 1,115,763 | 973,960 |
| 2010's | 998,490 | 905,588 | 864,063 | 863,063 | 892,037 | 981,064 | 1,075,430 | 1,112,159 | 1,181,137 | 1,238,041 |
| 2020's | 1,085,089 | 1,193,008 | 1,229,465 | 1,300,687 |
| - = No Data Reported; -- = Not Applicable; NA = Not Available; W = Withheld to avoid disclosure of individual company data. |
| Release Date: 3/29/2024 |
| Next Release Date: 8/30/2024 |
Referring Pages: