|
Download Data (XLS File) |
|
||||||||
|
||||||||
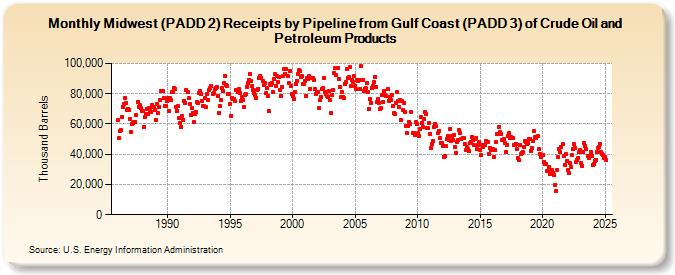
| Midwest (PADD 2) Receipts by Pipeline from Gulf Coast (PADD 3) of Crude Oil and Petroleum Products (Thousand Barrels) | ||||||||
| Year | Jan | Feb | Mar | Apr | May | Jun | Jul | Aug | Sep | Oct | Nov | Dec |
|---|---|---|---|---|---|---|---|---|---|---|---|---|
| 1986 | 62,486 | 50,441 | 55,236 | 55,781 | 64,735 | 71,465 | 73,159 | 77,437 | 73,677 | 69,171 | 70,150 | 69,535 |
| 1987 | 63,507 | 54,692 | 60,051 | 60,549 | 61,556 | 61,416 | 65,734 | 74,817 | 71,406 | 72,400 | 70,642 | 68,815 |
| 1988 | 68,311 | 57,854 | 64,508 | 66,600 | 70,008 | 66,559 | 70,357 | 69,495 | 67,600 | 72,615 | 71,513 | 70,894 |
| 1989 | 69,286 | 62,897 | 73,199 | 67,098 | 71,285 | 75,796 | 81,990 | 81,966 | 77,022 | 71,939 | 72,086 | 75,031 |
| 1990 | 76,991 | 68,550 | 77,429 | 75,894 | 81,063 | 80,870 | 83,924 | 83,397 | 71,322 | 68,442 | 71,719 | 63,861 |
| 1991 | 60,520 | 57,764 | 65,054 | 62,766 | 75,080 | 73,735 | 82,533 | 81,244 | 76,989 | 73,261 | 65,805 | 70,513 |
| 1992 | 67,558 | 60,988 | 66,882 | 68,045 | 74,589 | 73,641 | 80,794 | 81,785 | 80,113 | 75,378 | 72,034 | 71,626 |
| 1993 | 77,113 | 71,384 | 79,921 | 75,735 | 82,302 | 84,117 | 84,962 | 79,556 | 80,403 | 82,972 | 83,929 | 84,130 |
| 1994 | 78,693 | 67,499 | 71,961 | 75,574 | 84,072 | 82,126 | 86,916 | 91,832 | 86,010 | 85,108 | 79,530 | 79,830 |
| 1995 | 73,141 | 65,459 | 77,260 | 76,453 | 76,657 | 75,156 | 82,242 | 81,267 | 82,834 | 80,155 | 75,395 | 77,783 |
| 1996 | 76,068 | 71,362 | 79,159 | 80,010 | 84,506 | 87,020 | 89,270 | 93,173 | 88,373 | 85,092 | 82,482 | 80,797 |
| 1997 | 78,898 | 77,399 | 82,331 | 83,448 | 90,432 | 91,644 | 90,576 | 88,557 | 85,655 | 86,988 | 80,237 | 83,580 |
| 1998 | 78,678 | 68,355 | 86,368 | 85,866 | 86,947 | 80,989 | 89,945 | 92,851 | 85,437 | 91,563 | 87,696 | 90,945 |
| 1999 | 82,582 | 78,786 | 84,641 | 91,904 | 96,594 | 93,262 | 96,047 | 91,400 | 86,830 | 94,728 | 84,780 | 79,558 |
| 2000 | 78,496 | 76,655 | 81,335 | 86,563 | 88,600 | 93,142 | 95,521 | 94,861 | 91,124 | 91,842 | 86,267 | 86,585 |
| 2001 | 88,685 | 78,790 | 90,123 | 89,415 | 91,665 | 83,417 | 90,214 | 90,163 | 89,209 | 82,882 | 79,749 | 81,105 |
| 2002 | 81,360 | 70,325 | 75,629 | 78,015 | 83,042 | 83,613 | 90,459 | 81,419 | 79,877 | 78,181 | 77,959 | 81,515 |
| 2003 | 75,736 | 67,055 | 79,149 | 82,722 | 93,705 | 97,133 | 92,389 | 97,084 | 89,999 | 84,297 | 77,905 | 81,171 |
| 2004 | 78,123 | 77,462 | 86,632 | 87,814 | 96,244 | 90,515 | 91,169 | 97,683 | 85,076 | 89,360 | 87,717 | 91,666 |
| 2005 | 85,291 | 82,908 | 88,871 | 88,088 | 89,329 | 83,277 | 98,085 | 88,909 | 81,809 | 83,210 | 83,551 | 86,835 |
| 2006 | 80,939 | 70,109 | 76,472 | 74,044 | 83,702 | 84,935 | 87,768 | 91,284 | 84,648 | 74,842 | 76,621 | 73,972 |
| 2007 | 70,158 | 70,496 | 79,198 | 74,698 | 81,787 | 79,062 | 78,573 | 82,941 | 75,492 | 77,558 | 75,875 | 79,296 |
| 2008 | 71,821 | 66,976 | 66,755 | 74,040 | 80,944 | 75,234 | 71,216 | 75,798 | 62,714 | 74,876 | 69,175 | 74,141 |
| 2009 | 68,231 | 58,671 | 53,858 | 58,649 | 61,035 | 59,928 | 67,782 | 54,054 | 54,288 | 52,937 | 61,205 | 59,667 |
| 2010 | 53,799 | 52,044 | 56,427 | 64,371 | 60,733 | 57,778 | 63,153 | 67,733 | 66,444 | 57,141 | 57,101 | 60,655 |
| 2011 | 53,208 | 44,443 | 46,877 | 48,694 | 57,893 | 60,075 | 58,337 | 53,705 | 55,575 | 50,557 | 47,637 | 47,554 |
| 2012 | 45,222 | 38,451 | 38,849 | 45,498 | 50,150 | 52,012 | 49,526 | 56,788 | 48,671 | 52,238 | 49,497 | 52,432 |
| 2013 | 44,879 | 41,009 | 48,036 | 49,671 | 55,906 | 53,814 | 49,891 | 50,468 | 50,874 | 46,992 | 42,510 | 44,698 |
| 2014 | 43,506 | 42,125 | 47,273 | 48,141 | 51,151 | 49,138 | 46,254 | 49,850 | 51,012 | 43,431 | 45,889 | 47,899 |
| 2015 | 43,004 | 39,203 | 46,234 | 44,804 | 46,266 | 45,976 | 48,641 | 48,339 | 40,321 | 44,114 | 42,942 | 42,802 |
| 2016 | 43,476 | 38,037 | 42,568 | 47,788 | 53,497 | 53,324 | 58,001 | 54,449 | 53,460 | 49,269 | 49,361 | 49,756 |
| 2017 | 47,131 | 41,511 | 46,391 | 51,834 | 54,197 | 50,675 | 51,290 | 51,022 | 45,929 | 46,361 | 46,636 | 43,329 |
| 2018 | 37,299 | 35,922 | 45,997 | 39,872 | 40,989 | 41,149 | 44,843 | 48,765 | 48,366 | 46,952 | 47,450 | 50,168 |
| 2019 | 50,208 | 42,367 | 43,839 | 48,542 | 55,092 | 51,073 | 50,762 | 51,843 | 43,413 | 40,364 | 38,275 | 39,230 |
| 2020 | 39,388 | 35,051 | 33,634 | 33,725 | 29,138 | 28,760 | 31,614 | 26,886 | 27,332 | 29,475 | 27,332 | 26,328 |
| 2021 | 19,679 | 15,815 | 29,880 | 38,473 | 43,579 | 41,242 | 44,575 | 46,617 | 38,573 | 33,109 | 39,838 | 35,657 |
| 2022 | 29,305 | 27,419 | 33,865 | 31,526 | 39,578 | 43,300 | 46,502 | 44,250 | 34,870 | 36,496 | 37,745 | 41,148 |
| 2023 | 42,614 | 33,938 | 32,300 | 41,406 | 47,483 | 45,394 | 43,337 | 38,870 | 37,695 | 38,668 | 41,530 | 38,862 |
| 2024 | 32,683 | |||||||||||
| - = No Data Reported; -- = Not Applicable; NA = Not Available; W = Withheld to avoid disclosure of individual company data. |
| Release Date: 3/29/2024 |
| Next Release Date: 4/30/2024 |