|
Download Data (XLS File) |
|
||||||||
|
||||||||
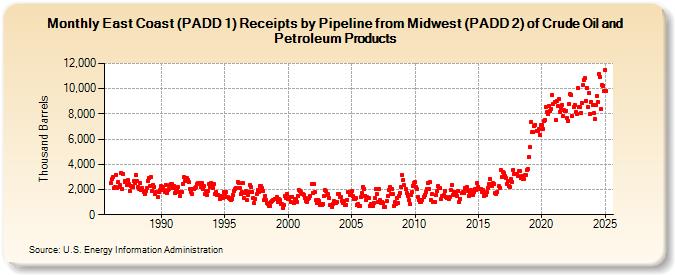
| East Coast (PADD 1) Receipts by Pipeline from Midwest (PADD 2) of Crude Oil and Petroleum Products (Thousand Barrels) | ||||||||
| Year | Jan | Feb | Mar | Apr | May | Jun | Jul | Aug | Sep | Oct | Nov | Dec |
|---|---|---|---|---|---|---|---|---|---|---|---|---|
| 1986 | 2,491 | 2,809 | 2,998 | 2,158 | 2,236 | 3,153 | 2,114 | 2,591 | 2,167 | 2,333 | 3,333 | 2,054 |
| 1987 | 3,211 | 2,713 | 2,612 | 2,359 | 2,729 | 2,423 | 1,869 | 2,284 | 2,215 | 2,238 | 2,706 | 2,495 |
| 1988 | 3,142 | 2,662 | 2,228 | 2,060 | 2,490 | 1,942 | 2,088 | 1,825 | 1,639 | 1,912 | 2,146 | 2,697 |
| 1989 | 2,910 | 2,265 | 3,002 | 1,866 | 2,360 | 2,196 | 1,608 | 1,769 | 1,819 | 1,385 | 1,771 | 2,000 |
| 1990 | 2,293 | 2,217 | 1,952 | 1,824 | 2,383 | 1,717 | 1,935 | 2,028 | 2,344 | 2,461 | 2,429 | 2,091 |
| 1991 | 2,294 | 1,692 | 1,950 | 2,045 | 2,172 | 1,779 | 1,498 | 1,781 | 2,476 | 2,965 | 2,673 | 2,817 |
| 1992 | 2,886 | 2,777 | 2,566 | 2,051 | 1,842 | 1,670 | 2,013 | 2,080 | 2,135 | 2,191 | 2,421 | 2,485 |
| 1993 | 2,506 | 2,219 | 2,515 | 2,068 | 2,264 | 1,631 | 1,895 | 1,603 | 1,889 | 2,431 | 2,213 | 2,549 |
| 1994 | 2,407 | 2,146 | 2,415 | 1,635 | 1,806 | 1,594 | 1,546 | 1,274 | 1,478 | 1,429 | 1,309 | 1,781 |
| 1995 | 1,635 | 1,840 | 1,371 | 1,403 | 1,351 | 1,282 | 1,179 | 1,238 | 1,532 | 1,863 | 2,038 | 2,150 |
| 1996 | 2,608 | 2,520 | 2,115 | 1,640 | 1,832 | 2,522 | 1,362 | 1,708 | 1,885 | 1,167 | 1,550 | 1,829 |
| 1997 | 2,353 | 2,196 | 1,763 | 1,323 | 915 | 1,277 | 1,630 | 1,976 | 1,819 | 2,297 | 2,271 | 2,096 |
| 1998 | 1,917 | 1,172 | 1,503 | 1,194 | 926 | 876 | 721 | 673 | 1,010 | 1,052 | 1,200 | 1,275 |
| 1999 | 1,254 | 1,366 | 982 | 1,212 | 1,152 | 843 | 843 | 563 | 763 | 1,491 | 1,346 | 1,650 |
| 2000 | 1,269 | 1,245 | 1,380 | 971 | 1,445 | 915 | 1,222 | 1,211 | 1,023 | 1,513 | 1,937 | 1,896 |
| 2001 | 1,792 | 1,634 | 1,614 | 1,557 | 1,331 | 1,081 | 1,011 | 1,286 | 1,316 | 1,456 | 2,402 | 1,711 |
| 2002 | 2,405 | 1,781 | 1,133 | 938 | 1,196 | 1,095 | 773 | 888 | 800 | 877 | 1,454 | 1,945 |
| 2003 | 1,855 | 1,561 | 1,631 | 1,291 | 805 | 642 | 820 | 1,080 | 987 | 956 | 1,008 | 1,665 |
| 2004 | 1,655 | 1,414 | 1,397 | 1,088 | 927 | 1,080 | 745 | 758 | 1,202 | 1,803 | 1,562 | 1,741 |
| 2005 | 1,855 | 1,455 | 1,280 | 1,216 | 1,289 | 791 | 871 | 669 | 671 | 1,386 | 1,707 | 2,193 |
| 2006 | 2,060 | 1,496 | 1,139 | 1,404 | 1,315 | 727 | 857 | 831 | 657 | 969 | 1,321 | 2,021 |
| 2007 | 1,637 | 979 | 2,004 | 1,185 | 906 | 1,010 | 897 | 631 | 598 | 1,111 | 1,467 | 1,968 |
| 2008 | 2,197 | 1,629 | 2,080 | 1,616 | 725 | 1,020 | 823 | 1,332 | 940 | 1,482 | 1,706 | 2,207 |
| 2009 | 3,164 | 2,768 | 2,322 | 2,021 | 1,688 | 1,458 | 1,135 | 864 | 1,572 | 1,799 | 2,302 | 2,498 |
| 2010 | 2,595 | 2,180 | 2,016 | 1,426 | 1,163 | 1,043 | 1,004 | 1,183 | 1,443 | 1,599 | 1,811 | 2,038 |
| 2011 | 2,544 | 2,079 | 2,557 | 1,207 | 1,644 | 1,007 | 982 | 1,021 | 1,549 | 1,862 | 2,267 | 2,132 |
| 2012 | 2,082 | 1,253 | 1,499 | 1,540 | 1,902 | 1,390 | 1,303 | 1,288 | 1,209 | 1,411 | 1,924 | 2,394 |
| 2013 | 1,583 | 1,820 | 1,641 | 1,822 | 1,465 | 1,864 | 1,003 | 1,240 | 1,689 | 1,765 | 1,725 | 2,118 |
| 2014 | 2,013 | 2,193 | 1,903 | 1,522 | 1,708 | 1,929 | 1,715 | 1,551 | 1,769 | 2,062 | 1,984 | 2,544 |
| 2015 | 2,228 | 2,074 | 2,037 | 1,834 | 2,000 | 1,512 | 1,631 | 1,534 | 1,815 | 2,145 | 2,418 | 2,871 |
| 2016 | 2,466 | 2,244 | 2,484 | 2,432 | 1,689 | 1,655 | 1,808 | 2,248 | 2,125 | 3,554 | 2,970 | 3,427 |
| 2017 | 3,336 | 3,072 | 2,905 | 2,453 | 2,643 | 2,257 | 2,220 | 2,803 | 2,631 | 3,549 | 3,203 | 3,220 |
| 2018 | 3,252 | 3,074 | 3,450 | 3,489 | 2,883 | 3,048 | 2,866 | 2,870 | 3,137 | 3,167 | 3,573 | 3,637 |
| 2019 | 4,567 | 5,335 | 7,381 | 6,540 | 6,582 | 7,073 | 7,119 | 6,673 | 6,680 | 6,807 | 6,329 | 7,112 |
| 2020 | 7,142 | 6,824 | 7,409 | 7,550 | 8,557 | 8,157 | 7,998 | 8,608 | 8,252 | 8,370 | 9,508 | 8,757 |
| 2021 | 8,934 | 7,548 | 9,034 | 8,615 | 9,163 | 8,131 | 8,448 | 8,741 | 7,817 | 8,278 | 8,199 | 8,252 |
| 2022 | 7,682 | 7,446 | 8,816 | 9,542 | 9,519 | 7,834 | 8,546 | 8,727 | 8,166 | 8,023 | 10,017 | 8,512 |
| 2023 | 8,543 | 8,061 | 6,899 | 9,522 | 10,693 | 10,812 | 9,050 | 10,063 | 9,393 | 10,314 | 8,017 | 8,129 |
| 2024 | 8,691 | |||||||||||
| - = No Data Reported; -- = Not Applicable; NA = Not Available; W = Withheld to avoid disclosure of individual company data. |
| Release Date: 3/29/2024 |
| Next Release Date: 4/30/2024 |