|
Download Data (XLS File) |
|
||||||||
|
||||||||
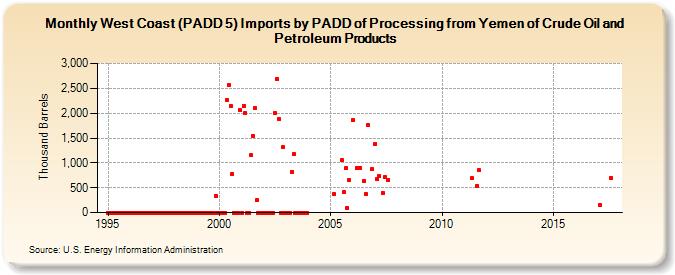
| West Coast (PADD 5) Imports by PADD of Processing from Yemen of Crude Oil and Petroleum Products (Thousand Barrels) | ||||||||
| Year | Jan | Feb | Mar | Apr | May | Jun | Jul | Aug | Sep | Oct | Nov | Dec |
|---|---|---|---|---|---|---|---|---|---|---|---|---|
| 1995 | 0 | 0 | 0 | 0 | 0 | 0 | 0 | 0 | 0 | 0 | 0 | 0 |
| 1996 | 0 | 0 | 0 | 0 | 0 | 0 | 0 | 0 | 0 | 0 | 0 | 0 |
| 1997 | 0 | 0 | 0 | 0 | 0 | 0 | 0 | 0 | 0 | 0 | 0 | 0 |
| 1998 | 0 | 0 | 0 | 0 | 0 | 0 | 0 | 0 | 0 | 0 | 0 | 0 |
| 1999 | 0 | 0 | 0 | 0 | 0 | 0 | 0 | 0 | 0 | 0 | 335 | 0 |
| 2000 | 0 | 0 | 0 | 0 | 2,271 | 2,557 | 2,141 | 778 | 0 | 0 | 0 | 2,055 |
| 2001 | 0 | 2,148 | 2,001 | 0 | 0 | 1,151 | 1,542 | 2,102 | 243 | 0 | 0 | 0 |
| 2002 | 0 | 0 | 0 | 0 | 0 | 0 | 1,998 | 2,694 | 1,881 | 0 | 1,311 | 0 |
| 2003 | 0 | 0 | 0 | 824 | 1,176 | 0 | 0 | 0 | 0 | 0 | 0 | 0 |
| 2005 | 373 | 1,050 | 405 | 894 | 94 | 665 | ||||||
| 2006 | 1,853 | 897 | 899 | 640 | 369 | 1,752 | 873 | |||||
| 2007 | 1,388 | 666 | 731 | 400 | 719 | 664 | ||||||
| 2011 | 691 | 539 | 847 | |||||||||
| 2017 | 159 | 696 | ||||||||||
| - = No Data Reported; -- = Not Applicable; NA = Not Available; W = Withheld to avoid disclosure of individual company data. |
| Release Date: 3/29/2024 |
| Next Release Date: 4/30/2024 |