|
Download Data (XLS File) |
|
||||||||
|
||||||||
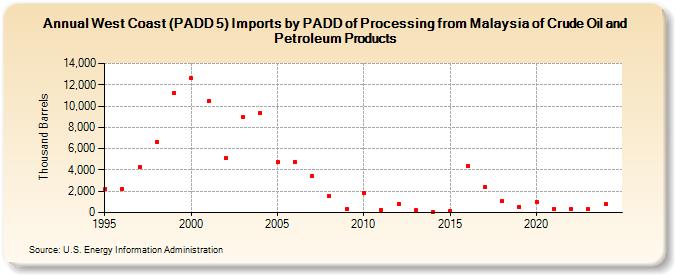
| West Coast (PADD 5) Imports by PADD of Processing from Malaysia of Crude Oil and Petroleum Products (Thousand Barrels) | ||||||||
| Decade | Year-0 | Year-1 | Year-2 | Year-3 | Year-4 | Year-5 | Year-6 | Year-7 | Year-8 | Year-9 |
|---|---|---|---|---|---|---|---|---|---|---|
| 1990's | 2,199 | 2,237 | 4,290 | 6,663 | 11,241 | |||||
| 2000's | 12,605 | 10,441 | 5,139 | 8,932 | 9,359 | 4,768 | 4,756 | 3,405 | 1,540 | 289 |
| 2010's | 1,840 | 279 | 828 | 212 | 84 | 184 | 4,408 | 2,405 | 1,095 | 547 |
| 2020's | 1,023 | 380 | 352 | 327 |
| - = No Data Reported; -- = Not Applicable; NA = Not Available; W = Withheld to avoid disclosure of individual company data. |
| Release Date: 6/28/2024 |
| Next Release Date: 8/30/2024 |