|
Download Data (XLS File) |
|
||||||||
|
||||||||
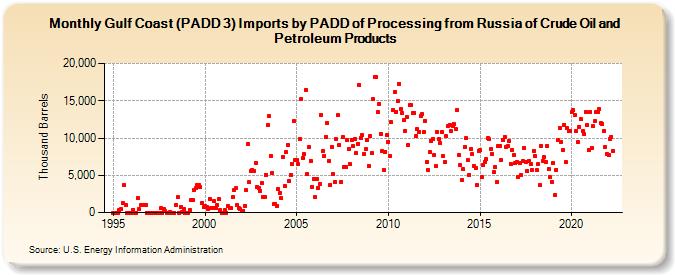
| Gulf Coast (PADD 3) Imports by PADD of Processing from Russia of Crude Oil and Petroleum Products (Thousand Barrels) | ||||||||
| Year | Jan | Feb | Mar | Apr | May | Jun | Jul | Aug | Sep | Oct | Nov | Dec |
|---|---|---|---|---|---|---|---|---|---|---|---|---|
| 1995 | 0 | 0 | 0 | 0 | 367 | 440 | 1,257 | 3,709 | 998 | 0 | 0 | 0 |
| 1996 | 0 | 394 | 0 | 0 | 1,948 | 429 | 1,017 | 998 | 1,017 | 1,008 | 0 | 0 |
| 1997 | 0 | 0 | 0 | 0 | 0 | 0 | 0 | 575 | 0 | 412 | 200 | 0 |
| 1998 | 0 | 94 | 0 | 0 | 0 | 1,006 | 2,044 | 0 | 785 | 125 | 483 | 0 |
| 1999 | 0 | 0 | 328 | 1,669 | 1,715 | 3,087 | 3,232 | 3,737 | 3,725 | 3,396 | 1,327 | 706 |
| 2000 | 898 | 740 | 465 | 1,820 | 650 | 621 | 1,516 | 645 | 975 | 1,758 | 320 | 0 |
| 2001 | 0 | 351 | 0 | 836 | 583 | 597 | 2,039 | 3,001 | 3,247 | 985 | 603 | 425 |
| 2002 | 163 | 241 | 939 | 2,963 | 9,174 | 4,037 | 5,509 | 5,737 | 5,571 | 6,650 | 3,364 | 3,257 |
| 2003 | 2,936 | 3,972 | 2,069 | 2,024 | 5,076 | 11,746 | 12,916 | 7,558 | 5,320 | 1,126 | 1,139 | 915 |
| 2004 | 3,148 | 2,629 | 1,923 | 7,511 | 3,569 | 8,107 | 9,083 | 4,177 | 5,068 | 6,552 | 12,222 | 7,092 |
| 2005 | 7,004 | 6,482 | 9,881 | 15,225 | 7,368 | 7,818 | 16,489 | 5,227 | 8,827 | 6,960 | 3,433 | 4,508 |
| 2006 | 2,030 | 4,552 | 3,359 | 3,805 | 13,122 | 8,219 | 7,633 | 10,176 | 12,006 | 6,975 | 3,757 | 8,829 |
| 2007 | 5,108 | 4,119 | 9,832 | 13,052 | 9,054 | 4,105 | 10,106 | 6,112 | 6,167 | 9,719 | 8,543 | 6,486 |
| 2008 | 9,784 | 8,890 | 9,850 | 8,051 | 9,240 | 17,102 | 10,036 | 10,384 | 7,879 | 8,481 | 9,796 | 6,251 |
| 2009 | 10,263 | 7,998 | 15,229 | 18,174 | 18,173 | 13,474 | 14,627 | 10,535 | 8,223 | 5,746 | 8,174 | 10,375 |
| 2010 | 9,506 | 7,598 | 12,088 | 13,750 | 16,228 | 13,543 | 14,951 | 17,307 | 13,899 | 13,406 | 12,435 | 10,992 |
| 2011 | 12,875 | 9,044 | 14,393 | 14,431 | 13,335 | 13,360 | 10,231 | 11,153 | 10,846 | 13,001 | 13,244 | 10,851 |
| 2012 | 12,319 | 6,751 | 5,661 | 8,136 | 9,642 | 9,844 | 7,738 | 6,184 | 10,844 | 9,807 | 9,316 | 10,834 |
| 2013 | 7,552 | 6,770 | 10,232 | 11,600 | 11,769 | 10,892 | 11,613 | 11,842 | 11,164 | 13,778 | 7,774 | 6,385 |
| 2014 | 4,396 | 5,819 | 8,808 | 9,948 | 7,022 | 5,099 | 8,467 | 7,834 | 6,277 | 5,992 | 3,658 | 8,316 |
| 2015 | 8,354 | 4,759 | 6,331 | 6,820 | 7,127 | 9,966 | 9,832 | 8,509 | 7,853 | 5,387 | 6,100 | 4,114 |
| 2016 | 8,922 | 8,984 | 7,042 | 9,785 | 10,155 | 8,840 | 8,952 | 9,645 | 6,474 | 8,433 | 7,723 | 6,603 |
| 2017 | 6,828 | 4,817 | 6,704 | 4,979 | 6,890 | 8,698 | 6,798 | 5,587 | 6,906 | 6,472 | 5,724 | 8,308 |
| 2018 | 7,533 | 5,673 | 6,497 | 3,720 | 8,981 | 6,965 | 7,407 | 6,810 | 8,896 | 5,854 | 4,718 | 4,161 |
| 2019 | 6,616 | 2,360 | 5,770 | 9,735 | 11,338 | 9,533 | 8,336 | 11,794 | 6,814 | 11,315 | 10,969 | 10,979 |
| 2020 | 13,447 | 13,721 | 13,096 | 10,884 | 9,475 | 11,518 | 12,501 | 10,887 | 10,550 | 13,510 | 11,690 | 8,391 |
| 2021 | 13,528 | 8,669 | 11,547 | 12,248 | 13,480 | 13,453 | 13,827 | 12,012 | 11,872 | 10,954 | 8,816 | 7,902 |
| 2022 | 7,664 | 9,915 | 10,193 | 8,291 | ||||||||
| - = No Data Reported; -- = Not Applicable; NA = Not Available; W = Withheld to avoid disclosure of individual company data. |
| Release Date: 6/30/2025 |
| Next Release Date: 7/31/2025 |