|
Download Data (XLS File) |
|
||||||||
|
||||||||
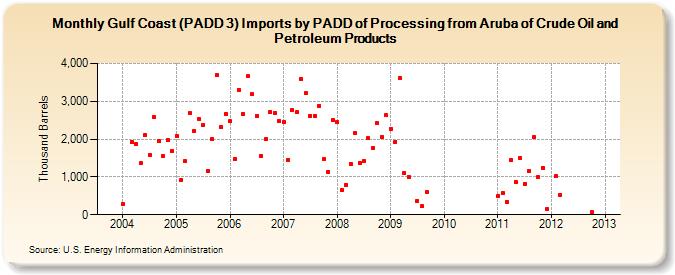
| Gulf Coast (PADD 3) Imports by PADD of Processing from Aruba of Crude Oil and Petroleum Products (Thousand Barrels) | ||||||||
| Year | Jan | Feb | Mar | Apr | May | Jun | Jul | Aug | Sep | Oct | Nov | Dec |
|---|---|---|---|---|---|---|---|---|---|---|---|---|
| 2004 | 276 | 1,934 | 1,867 | 1,357 | 2,106 | 1,590 | 2,578 | 1,961 | 1,544 | 1,968 | 1,684 | |
| 2005 | 2,094 | 922 | 1,410 | 2,691 | 2,226 | 2,536 | 2,370 | 1,155 | 2,002 | 3,684 | 2,325 | 2,659 |
| 2006 | 2,470 | 1,473 | 3,311 | 2,663 | 3,656 | 3,185 | 2,614 | 1,548 | 1,994 | 2,718 | 2,702 | 2,481 |
| 2007 | 2,453 | 1,449 | 2,758 | 2,706 | 3,592 | 3,207 | 2,621 | 2,623 | 2,884 | 1,464 | 1,140 | 2,509 |
| 2008 | 2,449 | 649 | 794 | 1,354 | 2,156 | 1,371 | 1,422 | 2,021 | 1,765 | 2,413 | 2,062 | 2,629 |
| 2009 | 2,277 | 1,929 | 3,615 | 1,115 | 1,009 | 375 | 222 | 596 | ||||
| 2011 | 490 | 568 | 345 | 1,458 | 867 | 1,503 | 815 | 1,168 | 2,046 | 1,000 | 1,246 | 150 |
| 2012 | 1,016 | 532 | 59 | |||||||||
| - = No Data Reported; -- = Not Applicable; NA = Not Available; W = Withheld to avoid disclosure of individual company data. |
| Release Date: 6/28/2024 |
| Next Release Date: 7/31/2024 |