|
Download Data (XLS File) |
|
||||||||
|
||||||||
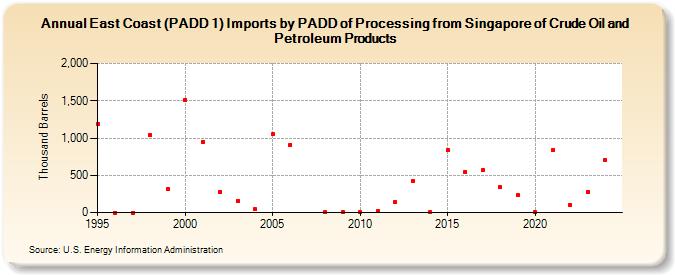
| East Coast (PADD 1) Imports by PADD of Processing from Singapore of Crude Oil and Petroleum Products (Thousand Barrels) | ||||||||
| Decade | Year-0 | Year-1 | Year-2 | Year-3 | Year-4 | Year-5 | Year-6 | Year-7 | Year-8 | Year-9 |
|---|---|---|---|---|---|---|---|---|---|---|
| 1990's | 1,192 | 0 | 0 | 1,038 | 316 | |||||
| 2000's | 1,512 | 947 | 281 | 161 | 44 | 1,049 | 910 | 2 | 1 | |
| 2010's | 1 | 24 | 140 | 422 | 3 | 834 | 545 | 567 | 341 | 234 |
| 2020's | 4 | 841 | 102 | 281 |
| - = No Data Reported; -- = Not Applicable; NA = Not Available; W = Withheld to avoid disclosure of individual company data. |
| Release Date: 6/28/2024 |
| Next Release Date: 8/30/2024 |