|
Download Data (XLS File) |
|
||||||||
|
||||||||
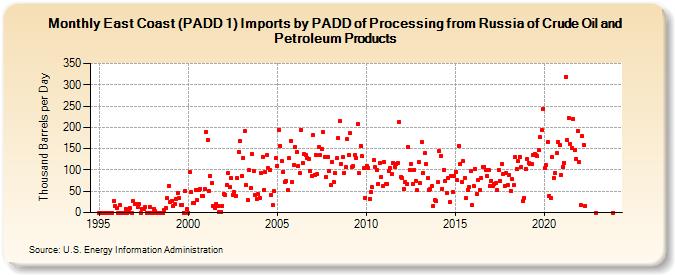
| East Coast (PADD 1) Imports by PADD of Processing from Russia of Crude Oil and Petroleum Products (Thousand Barrels per Day) | ||||||||
| Year | Jan | Feb | Mar | Apr | May | Jun | Jul | Aug | Sep | Oct | Nov | Dec |
|---|---|---|---|---|---|---|---|---|---|---|---|---|
| 1995 | 0 | 0 | 0 | 0 | 0 | 0 | 0 | 0 | 0 | 0 | 28 | 15 |
| 1996 | 11 | 0 | 18 | 0 | 0 | 0 | 9 | 0 | 2 | 10 | 0 | 26 |
| 1997 | 21 | 19 | 13 | 20 | 0 | 8 | 9 | 13 | 0 | 0 | 14 | 0 |
| 1998 | 0 | 9 | 3 | 0 | 0 | 0 | 0 | 0 | 7 | 11 | 34 | 63 |
| 1999 | 25 | 28 | 16 | 20 | 33 | 46 | 34 | 18 | 18 | 0 | 50 | 8 |
| 2000 | 0 | 95 | 48 | 22 | 23 | 54 | 29 | 53 | 56 | 40 | 39 | 55 |
| 2001 | 190 | 171 | 50 | 87 | 69 | 15 | 11 | 21 | 16 | 2 | 2 | 16 |
| 2002 | 44 | 42 | 65 | 93 | 59 | 81 | 42 | 48 | 40 | 81 | 143 | 169 |
| 2003 | 86 | 129 | 191 | 65 | 29 | 99 | 58 | 137 | 97 | 41 | 33 | 43 |
| 2004 | 35 | 94 | 131 | 53 | 95 | 135 | 104 | 100 | 41 | 17 | 50 | 127 |
| 2005 | 110 | 195 | 156 | 120 | 96 | 72 | 74 | 52 | 127 | 169 | 72 | 112 |
| 2006 | 153 | 142 | 110 | 92 | 195 | 117 | 137 | 136 | 128 | 126 | 98 | 85 |
| 2007 | 181 | 89 | 135 | 90 | 153 | 134 | 150 | 188 | 131 | 84 | 131 | 97 |
| 2008 | 65 | 119 | 71 | 93 | 127 | 174 | 215 | 114 | 130 | 94 | 106 | 172 |
| 2009 | 135 | 186 | 106 | 109 | 134 | 127 | 209 | 92 | 157 | 132 | 104 | 35 |
| 2010 | 110 | 105 | 33 | 48 | 59 | 123 | 106 | 99 | 68 | 117 | 84 | 62 |
| 2011 | 119 | 66 | 67 | 97 | 105 | 91 | 117 | 107 | 114 | 117 | 213 | 83 |
| 2012 | 81 | 55 | 72 | 68 | 153 | 101 | 115 | 67 | 101 | 74 | 52 | 118 |
| 2013 | 69 | 166 | 93 | 139 | 113 | 80 | 54 | 55 | 62 | 16 | 29 | 28 |
| 2014 | 71 | 145 | 133 | 56 | 101 | 73 | 47 | 82 | 24 | 86 | 48 | 87 |
| 2015 | 96 | 76 | 157 | 114 | 72 | 121 | 82 | 34 | 54 | 60 | 97 | 18 |
| 2016 | 62 | 103 | 44 | 76 | 53 | 81 | 108 | 108 | 100 | 87 | 99 | 63 |
| 2017 | 75 | 63 | 66 | 70 | 54 | 100 | 74 | 115 | 91 | 63 | 93 | 64 |
| 2018 | 89 | 51 | 78 | 64 | 130 | 102 | 120 | 131 | 107 | 26 | 35 | 103 |
| 2019 | 125 | 117 | 113 | 113 | 135 | 138 | 135 | 132 | 146 | 177 | 193 | 244 |
| 2020 | 104 | 111 | 166 | 40 | 35 | 130 | 82 | 94 | 140 | 166 | 158 | 88 |
| 2021 | 108 | 117 | 319 | 170 | 223 | 162 | 152 | 220 | 147 | 126 | 192 | 118 |
| 2022 | 17 | 179 | 159 | 16 | 0 | |||||||
| 2023 | 0 | |||||||||||
| - = No Data Reported; -- = Not Applicable; NA = Not Available; W = Withheld to avoid disclosure of individual company data. |
| Release Date: 3/29/2024 |
| Next Release Date: 4/30/2024 |