|
Download Data (XLS File) |
|
||||||||
|
||||||||
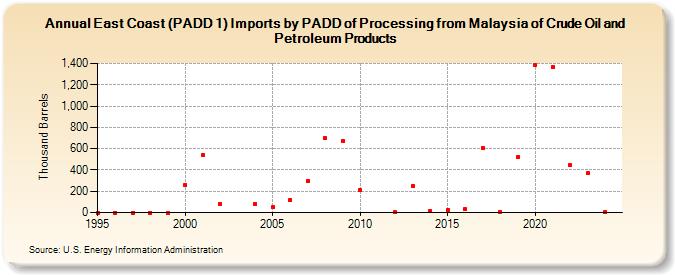
| East Coast (PADD 1) Imports by PADD of Processing from Malaysia of Crude Oil and Petroleum Products (Thousand Barrels) | ||||||||
| Decade | Year-0 | Year-1 | Year-2 | Year-3 | Year-4 | Year-5 | Year-6 | Year-7 | Year-8 | Year-9 |
|---|---|---|---|---|---|---|---|---|---|---|
| 1990's | 0 | 0 | 0 | 0 | 0 | |||||
| 2000's | 261 | 541 | 78 | 80 | 50 | 119 | 297 | 697 | 671 | |
| 2010's | 210 | 3 | 247 | 16 | 26 | 30 | 608 | 6 | 521 | |
| 2020's | 1,386 | 1,366 | 443 | 371 |
| - = No Data Reported; -- = Not Applicable; NA = Not Available; W = Withheld to avoid disclosure of individual company data. |
| Release Date: 6/28/2024 |
| Next Release Date: 8/30/2024 |