|
Download Data (XLS File) |
|
||||||||
|
||||||||
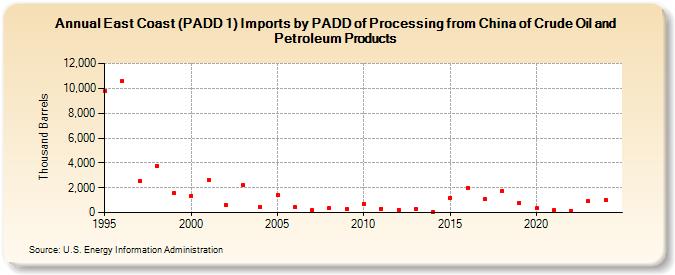
| East Coast (PADD 1) Imports by PADD of Processing from China of Crude Oil and Petroleum Products (Thousand Barrels) | ||||||||
| Decade | Year-0 | Year-1 | Year-2 | Year-3 | Year-4 | Year-5 | Year-6 | Year-7 | Year-8 | Year-9 |
|---|---|---|---|---|---|---|---|---|---|---|
| 1990's | 9,779 | 10,588 | 2,535 | 3,781 | 1,590 | |||||
| 2000's | 1,346 | 2,630 | 607 | 2,212 | 480 | 1,427 | 443 | 205 | 345 | 277 |
| 2010's | 709 | 326 | 208 | 321 | 76 | 1,212 | 1,987 | 1,066 | 1,743 | 778 |
| 2020's | 328 | 195 | 131 | 901 |
| - = No Data Reported; -- = Not Applicable; NA = Not Available; W = Withheld to avoid disclosure of individual company data. |
| Release Date: 6/28/2024 |
| Next Release Date: 8/30/2024 |