|
Download Data (XLS File) |
|
||||||||
|
||||||||
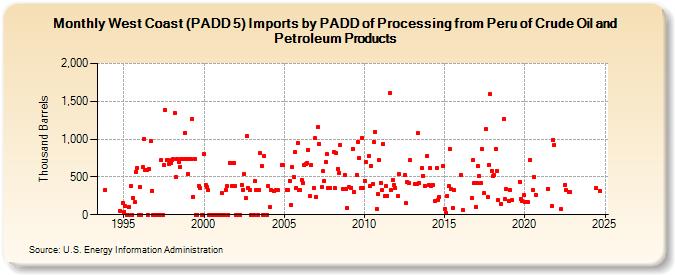
| West Coast (PADD 5) Imports by PADD of Processing from Peru of Crude Oil and Petroleum Products (Thousand Barrels) | ||||||||
| Year | Jan | Feb | Mar | Apr | May | Jun | Jul | Aug | Sep | Oct | Nov | Dec |
|---|---|---|---|---|---|---|---|---|---|---|---|---|
| 1993 | 331 | |||||||||||
| 1994 | 50 | 157 | ||||||||||
| 1995 | 35 | 111 | 0 | 0 | 100 | 375 | 0 | 219 | 168 | 570 | 623 | 0 |
| 1996 | 372 | 0 | 628 | 1,002 | 592 | 594 | 0 | 604 | 970 | 317 | 0 | 0 |
| 1997 | 0 | 0 | 0 | 0 | 720 | 0 | 657 | 1,383 | 718 | 722 | 676 | 686 |
| 1998 | 718 | 736 | 1,351 | 502 | 740 | 703 | 636 | 738 | 740 | 738 | 1,084 | 740 |
| 1999 | 536 | 740 | 740 | 1,267 | 236 | 741 | 0 | 0 | 377 | 350 | 0 | 0 |
| 2000 | 804 | 391 | 362 | 325 | 0 | 0 | 0 | 0 | 0 | 0 | 0 | 0 |
| 2001 | 0 | 290 | 0 | 0 | 330 | 376 | 0 | 689 | 690 | 380 | 679 | 379 |
| 2002 | 0 | 0 | 0 | 0 | 398 | 328 | 533 | 220 | 1,040 | 350 | 330 | 0 |
| 2003 | 0 | 0 | 445 | 327 | 0 | 330 | 817 | 647 | 0 | 773 | 0 | 0 |
| 2004 | 383 | 99 | 333 | 310 | 330 | 329 | 658 | 660 | ||||
| 2005 | 321 | 329 | 450 | 132 | 627 | 498 | 827 | 351 | 954 | 322 | ||
| 2006 | 330 | 461 | 419 | 653 | 673 | 684 | 858 | 243 | 660 | 354 | 1,008 | |
| 2007 | 235 | 1,157 | 937 | 360 | 573 | 451 | 702 | 798 | 347 | 350 | ||
| 2008 | 832 | 350 | 811 | 611 | 558 | 926 | 341 | 529 | 344 | 95 | ||
| 2009 | 364 | 359 | 871 | 302 | 529 | 962 | 747 | 347 | 1,015 | 349 | ||
| 2010 | 450 | 694 | 779 | 379 | 644 | 400 | 956 | 1,100 | 77 | 271 | 721 | |
| 2011 | 423 | 330 | 936 | 241 | 379 | 249 | 1,607 | 329 | 460 | 399 | 359 | |
| 2012 | 241 | 536 | 523 | 150 | 433 | 417 | 717 | |||||
| 2013 | 401 | 403 | 1,075 | 417 | 621 | 517 | 380 | 782 | ||||
| 2014 | 394 | 617 | 380 | 399 | 176 | 622 | 192 | 234 | 638 | |||
| 2015 | 82 | 23 | 245 | 377 | 867 | 337 | 95 | 328 | ||||
| 2016 | 529 | 59 | 220 | 720 | 415 | 103 | ||||||
| 2017 | 421 | 639 | 512 | 418 | 867 | 281 | 1,127 | 237 | 660 | 1,593 | 576 | |
| 2018 | 507 | 521 | 875 | 583 | 194 | 141 | 1,262 | 206 | 337 | |||
| 2019 | 175 | 330 | 189 | 438 | 209 | 181 | 258 | |||||
| 2020 | 171 | 172 | 728 | 321 | 500 | 261 | ||||||
| 2021 | 346 | 114 | 985 | 919 | ||||||||
| 2022 | 73 | 399 | 321 | 298 | 299 | |||||||
| - = No Data Reported; -- = Not Applicable; NA = Not Available; W = Withheld to avoid disclosure of individual company data. |
| Release Date: 3/29/2024 |
| Next Release Date: 4/30/2024 |