|
Download Data (XLS File) |
|
||||||||
|
||||||||
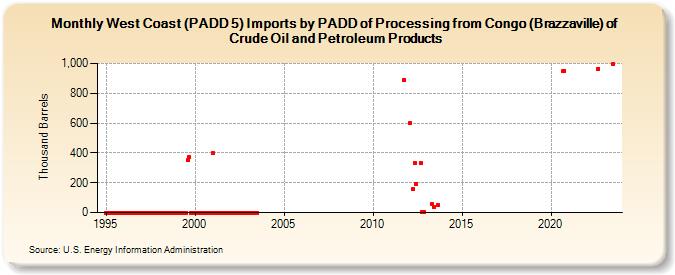
| West Coast (PADD 5) Imports by PADD of Processing from Congo (Brazzaville) of Crude Oil and Petroleum Products (Thousand Barrels) | ||||||||
| Year | Jan | Feb | Mar | Apr | May | Jun | Jul | Aug | Sep | Oct | Nov | Dec |
|---|---|---|---|---|---|---|---|---|---|---|---|---|
| 1995 | 0 | 0 | 0 | 0 | 0 | 0 | 0 | 0 | 0 | 0 | 0 | 0 |
| 1996 | 0 | 0 | 0 | 0 | 0 | 0 | 0 | 0 | 0 | 0 | 0 | 0 |
| 1997 | 0 | 0 | 0 | 0 | 0 | 0 | 0 | 0 | 0 | 0 | 0 | 0 |
| 1998 | 0 | 0 | 0 | 0 | 0 | 0 | 0 | 0 | 0 | 0 | 0 | 0 |
| 1999 | 0 | 0 | 0 | 0 | 0 | 0 | 0 | 351 | 372 | 0 | 0 | 0 |
| 2000 | 0 | 0 | 0 | 0 | 0 | 0 | 0 | 0 | 0 | 0 | 0 | 0 |
| 2001 | 399 | 0 | 0 | 0 | 0 | 0 | 0 | 0 | 0 | 0 | 0 | 0 |
| 2002 | 0 | 0 | 0 | 0 | 0 | 0 | 0 | 0 | 0 | 0 | 0 | 0 |
| 2003 | 0 | 0 | 0 | 0 | 0 | 0 | 0 | |||||
| 2011 | 890 | |||||||||||
| 2012 | 598 | 155 | 334 | 190 | 333 | 5 | 3 | |||||
| 2013 | 57 | 39 | 52 | |||||||||
| 2020 | 948 | 950 | ||||||||||
| 2022 | 965 | |||||||||||
| 2023 | 994 | |||||||||||
| - = No Data Reported; -- = Not Applicable; NA = Not Available; W = Withheld to avoid disclosure of individual company data. |
| Release Date: 6/28/2024 |
| Next Release Date: 7/31/2024 |