|
Download Data (XLS File) |
|
||||||||
|
||||||||
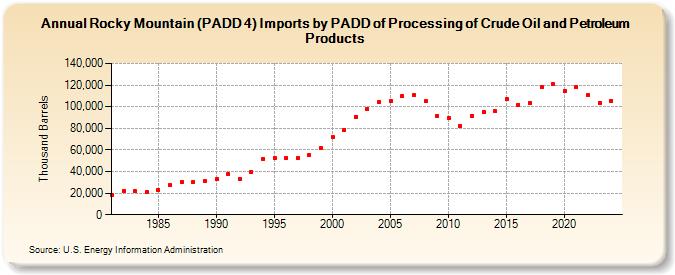
| Rocky Mountain (PADD 4) Imports by PADD of Processing of Crude Oil and Petroleum Products (Thousand Barrels) | ||||||||
| Decade | Year-0 | Year-1 | Year-2 | Year-3 | Year-4 | Year-5 | Year-6 | Year-7 | Year-8 | Year-9 |
|---|---|---|---|---|---|---|---|---|---|---|
| 1980's | 18,390 | 21,766 | 21,544 | 21,089 | 23,246 | 27,279 | 30,364 | 30,261 | 30,861 | |
| 1990's | 32,599 | 37,569 | 33,015 | 39,381 | 51,889 | 52,564 | 52,957 | 52,665 | 55,322 | 61,870 |
| 2000's | 71,857 | 78,762 | 90,707 | 97,975 | 103,959 | 105,485 | 109,999 | 110,541 | 104,939 | 91,507 |
| 2010's | 89,636 | 82,068 | 91,687 | 95,299 | 95,725 | 107,024 | 101,840 | 103,642 | 117,947 | 120,694 |
| 2020's | 114,930 | 118,347 | 110,554 | 103,539 |
| - = No Data Reported; -- = Not Applicable; NA = Not Available; W = Withheld to avoid disclosure of individual company data. |
| Release Date: 8/30/2024 |
| Next Release Date: 8/29/2025 |