|
Download Data (XLS File) |
|
||||||||
|
||||||||
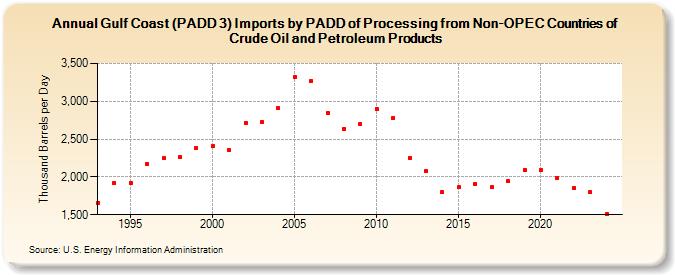
| Gulf Coast (PADD 3) Imports by PADD of Processing from Non-OPEC Countries of Crude Oil and Petroleum Products (Thousand Barrels per Day) | ||||||||
| Decade | Year-0 | Year-1 | Year-2 | Year-3 | Year-4 | Year-5 | Year-6 | Year-7 | Year-8 | Year-9 |
|---|---|---|---|---|---|---|---|---|---|---|
| 1990's | 1,657 | 1,921 | 1,920 | 2,175 | 2,244 | 2,263 | 2,376 | |||
| 2000's | 2,411 | 2,352 | 2,718 | 2,729 | 2,906 | 3,322 | 3,271 | 2,846 | 2,638 | 2,697 |
| 2010's | 2,902 | 2,782 | 2,256 | 2,076 | 1,794 | 1,861 | 1,901 | 1,862 | 1,940 | 2,095 |
| 2020's | 2,088 | 1,983 | 1,856 | 1,658 |
| - = No Data Reported; -- = Not Applicable; NA = Not Available; W = Withheld to avoid disclosure of individual company data. |
| Release Date: 3/29/2024 |
| Next Release Date: 8/30/2024 |