|
Download Data (XLS File) |
|
||||||||
|
||||||||
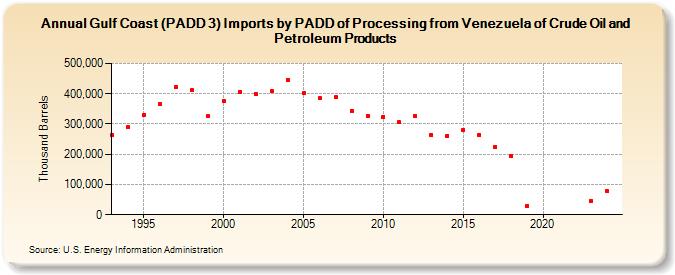
| Gulf Coast (PADD 3) Imports by PADD of Processing from Venezuela of Crude Oil and Petroleum Products (Thousand Barrels) | ||||||||
| Decade | Year-0 | Year-1 | Year-2 | Year-3 | Year-4 | Year-5 | Year-6 | Year-7 | Year-8 | Year-9 |
|---|---|---|---|---|---|---|---|---|---|---|
| 1990's | 263,299 | 288,550 | 330,803 | 365,140 | 421,780 | 410,950 | 325,336 | |||
| 2000's | 375,048 | 406,566 | 399,296 | 407,918 | 446,916 | 401,497 | 385,289 | 387,669 | 344,185 | 327,131 |
| 2010's | 324,001 | 305,218 | 326,302 | 263,700 | 261,577 | 280,375 | 264,229 | 223,982 | 192,663 | 29,718 |
| 2020's | 47,007 |
| - = No Data Reported; -- = Not Applicable; NA = Not Available; W = Withheld to avoid disclosure of individual company data. |
| Release Date: 3/29/2024 |
| Next Release Date: 8/30/2024 |