|
Download Data (XLS File) |
|
||||||||
|
||||||||
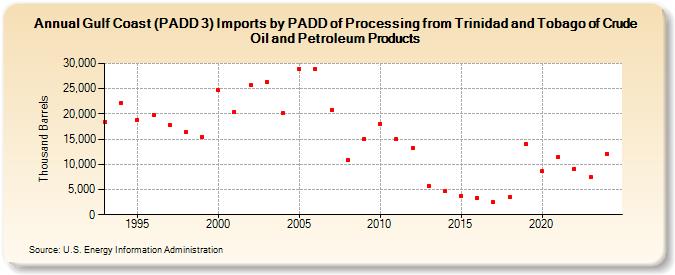
| Gulf Coast (PADD 3) Imports by PADD of Processing from Trinidad and Tobago of Crude Oil and Petroleum Products (Thousand Barrels) | ||||||||
| Decade | Year-0 | Year-1 | Year-2 | Year-3 | Year-4 | Year-5 | Year-6 | Year-7 | Year-8 | Year-9 |
|---|---|---|---|---|---|---|---|---|---|---|
| 1990's | 18,417 | 22,233 | 18,798 | 19,816 | 17,775 | 16,425 | 15,483 | |||
| 2000's | 24,675 | 20,448 | 25,720 | 26,337 | 20,118 | 28,924 | 28,951 | 20,844 | 10,845 | 15,111 |
| 2010's | 18,027 | 14,959 | 13,295 | 5,785 | 4,606 | 3,773 | 3,294 | 2,443 | 3,555 | 14,052 |
| 2020's | 8,611 | 11,421 | 9,076 | 7,443 |
| - = No Data Reported; -- = Not Applicable; NA = Not Available; W = Withheld to avoid disclosure of individual company data. |
| Release Date: 3/29/2024 |
| Next Release Date: 8/30/2024 |