|
Download Data (XLS File) |
|
||||||||
|
||||||||
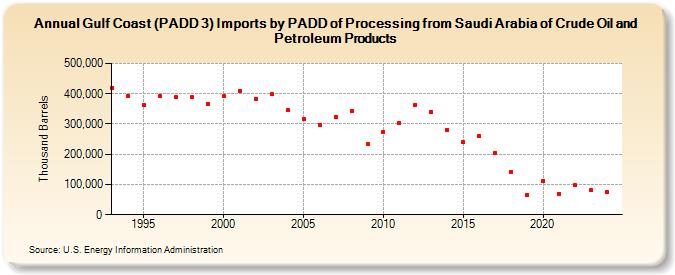
| Gulf Coast (PADD 3) Imports by PADD of Processing from Saudi Arabia of Crude Oil and Petroleum Products (Thousand Barrels) | ||||||||
| Decade | Year-0 | Year-1 | Year-2 | Year-3 | Year-4 | Year-5 | Year-6 | Year-7 | Year-8 | Year-9 |
|---|---|---|---|---|---|---|---|---|---|---|
| 1990's | 419,199 | 393,189 | 363,970 | 393,128 | 389,660 | 389,715 | 367,149 | |||
| 2000's | 391,645 | 410,420 | 382,584 | 398,013 | 345,894 | 318,075 | 297,702 | 324,169 | 342,126 | 233,639 |
| 2010's | 274,522 | 303,204 | 364,272 | 340,210 | 280,110 | 240,367 | 260,072 | 205,008 | 142,583 | 64,372 |
| 2020's | 112,596 | 69,961 | 97,250 | 80,134 |
| - = No Data Reported; -- = Not Applicable; NA = Not Available; W = Withheld to avoid disclosure of individual company data. |
| Release Date: 8/30/2024 |
| Next Release Date: 8/29/2025 |