|
Download Data (XLS File) |
|
||||||||
|
||||||||
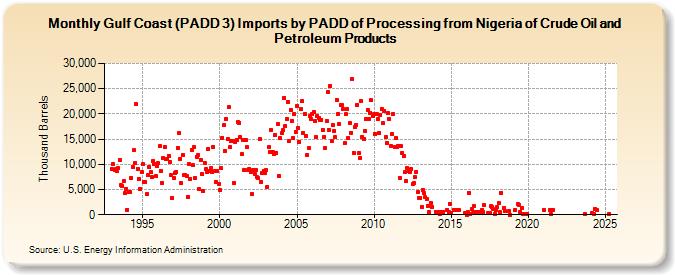
| Gulf Coast (PADD 3) Imports by PADD of Processing from Nigeria of Crude Oil and Petroleum Products (Thousand Barrels) | ||||||||
| Year | Jan | Feb | Mar | Apr | May | Jun | Jul | Aug | Sep | Oct | Nov | Dec |
|---|---|---|---|---|---|---|---|---|---|---|---|---|
| 1993 | 9,009 | 10,011 | 8,936 | 9,045 | 8,588 | 9,244 | 10,804 | 5,837 | 5,656 | 6,711 | 4,264 | 5,176 |
| 1994 | 1,009 | 4,511 | 4,584 | 7,334 | 9,542 | 12,767 | 10,246 | 21,912 | 9,119 | 7,137 | 5,110 | 8,377 |
| 1995 | 9,982 | 6,494 | 6,576 | 4,052 | 7,816 | 9,399 | 8,431 | 7,458 | 10,695 | 10,154 | 7,648 | 9,568 |
| 1996 | 10,172 | 13,628 | 8,695 | 6,330 | 11,256 | 13,497 | 10,963 | 11,125 | 11,647 | 10,522 | 7,874 | 3,318 |
| 1997 | 7,380 | 8,176 | 8,513 | 13,311 | 16,120 | 11,112 | 6,289 | 11,903 | 7,788 | 7,821 | 7,590 | 3,570 |
| 1998 | 9,995 | 7,040 | 12,904 | 9,772 | 13,412 | 7,371 | 11,519 | 11,875 | 5,007 | 10,840 | 8,066 | 4,746 |
| 1999 | 10,299 | 9,071 | 8,505 | 13,114 | 8,745 | 9,208 | 8,379 | 13,498 | 8,604 | 6,556 | 8,729 | 6,164 |
| 2000 | 4,916 | 9,198 | 15,293 | 17,796 | 12,593 | 19,085 | 15,022 | 21,320 | 13,389 | 14,606 | 14,636 | 6,331 |
| 2001 | 14,383 | 14,876 | 18,435 | 18,260 | 15,332 | 11,978 | 14,813 | 8,959 | 14,839 | 13,370 | 8,912 | 9,139 |
| 2002 | 8,445 | 4,078 | 8,928 | 8,121 | 8,966 | 7,400 | 7,190 | 15,065 | 6,457 | 8,266 | 8,728 | 8,305 |
| 2003 | 8,786 | 5,548 | 13,349 | 12,521 | 16,808 | 12,443 | 12,091 | 15,782 | 12,253 | 17,900 | 7,772 | 15,177 |
| 2004 | 16,169 | 16,728 | 23,249 | 17,610 | 18,995 | 22,425 | 14,667 | 20,848 | 18,687 | 15,259 | 19,994 | 16,475 |
| 2005 | 21,604 | 17,214 | 14,495 | 20,874 | 22,527 | 16,174 | 20,024 | 15,593 | 11,899 | 13,156 | 19,545 | 19,022 |
| 2006 | 20,048 | 20,356 | 18,682 | 15,456 | 19,613 | 19,266 | 18,713 | 18,846 | 16,899 | 15,506 | 13,210 | 18,601 |
| 2007 | 24,372 | 16,899 | 25,493 | 14,588 | 17,813 | 16,697 | 15,317 | 22,808 | 19,998 | 18,070 | 21,774 | 21,701 |
| 2008 | 21,037 | 14,220 | 19,905 | 20,927 | 15,268 | 18,216 | 16,259 | 26,849 | 12,322 | 17,352 | 17,890 | 21,816 |
| 2009 | 12,259 | 11,314 | 22,517 | 15,466 | 15,114 | 16,625 | 18,976 | 20,788 | 18,917 | 20,224 | 22,673 | 19,514 |
| 2010 | 19,946 | 15,974 | 20,052 | 18,922 | 16,293 | 19,682 | 20,880 | 18,133 | 20,667 | 15,372 | 14,318 | 20,174 |
| 2011 | 18,982 | 13,588 | 16,061 | 19,992 | 13,450 | 15,237 | 13,384 | 13,700 | 7,349 | 13,560 | 12,252 | 11,636 |
| 2012 | 8,397 | 6,629 | 9,289 | 8,769 | 8,557 | 9,085 | 6,082 | 6,201 | 7,474 | 8,502 | 4,495 | 3,365 |
| 2013 | 3,330 | 1,609 | 4,827 | 4,255 | 3,449 | 3,021 | 1,810 | 533 | 2,410 | 1,595 | ||
| 2014 | 600 | 491 | 233 | 632 | 252 | 567 | 949 | 550 | 2,185 | |||
| 2015 | 398 | 974 | 998 | 947 | 293 | |||||||
| 2016 | 12 | 479 | 4,339 | 210 | 1,151 | 258 | 1,703 | 474 | 592 | 497 | 502 | |
| 2017 | 947 | 512 | 1,865 | 376 | 364 | 1,668 | 1,624 | 1,111 | 144 | 946 | ||
| 2018 | 1,508 | 2,318 | 474 | 4,317 | 1,421 | 694 | 654 | 3 | ||||
| 2019 | 949 | 2,048 | 1,914 | 630 | 1,251 | 207 | 205 | |||||
| 2021 | 950 | 958 | 76 | 1,030 | ||||||||
| 2023 | 186 | |||||||||||
| 2024 | 304 | 190 | ||||||||||
| - = No Data Reported; -- = Not Applicable; NA = Not Available; W = Withheld to avoid disclosure of individual company data. |
| Release Date: 6/28/2024 |
| Next Release Date: 7/31/2024 |