|
Download Data (XLS File) |
|
||||||||
|
||||||||
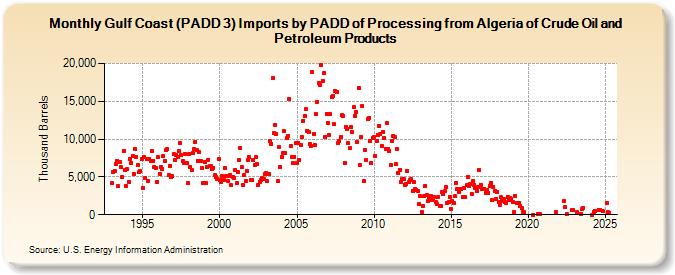
| Gulf Coast (PADD 3) Imports by PADD of Processing from Algeria of Crude Oil and Petroleum Products (Thousand Barrels) | ||||||||
| Year | Jan | Feb | Mar | Apr | May | Jun | Jul | Aug | Sep | Oct | Nov | Dec |
|---|---|---|---|---|---|---|---|---|---|---|---|---|
| 1993 | 4,155 | 5,639 | 5,730 | 6,671 | 7,079 | 3,734 | 6,965 | 6,280 | 5,022 | 8,471 | 5,870 | 3,786 |
| 1994 | 5,980 | 4,331 | 7,405 | 6,818 | 7,733 | 5,351 | 8,683 | 7,652 | 6,578 | 5,593 | 5,719 | 7,342 |
| 1995 | 3,596 | 7,665 | 4,915 | 7,365 | 4,464 | 7,351 | 7,137 | 8,384 | 7,081 | 6,363 | 6,194 | 4,298 |
| 1996 | 7,603 | 5,439 | 6,340 | 6,002 | 7,774 | 7,158 | 8,512 | 8,666 | 5,187 | 6,484 | 5,026 | 5,064 |
| 1997 | 7,974 | 7,285 | 7,950 | 7,663 | 8,368 | 9,446 | 7,844 | 7,092 | 6,843 | 8,065 | 6,815 | 4,165 |
| 1998 | 8,005 | 6,316 | 5,935 | 8,216 | 8,667 | 9,605 | 8,521 | 7,169 | 8,246 | 7,061 | 6,208 | 4,240 |
| 1999 | 6,987 | 4,170 | 6,264 | 7,300 | 6,401 | 6,445 | 6,045 | 6,233 | 5,271 | 5,022 | 4,739 | 7,335 |
| 2000 | 4,634 | 4,359 | 5,127 | 4,598 | 6,137 | 5,115 | 4,520 | 5,072 | 5,213 | 3,869 | 5,010 | 4,916 |
| 2001 | 5,976 | 4,176 | 5,677 | 7,221 | 8,854 | 6,247 | 3,912 | 5,215 | 4,520 | 5,770 | 7,208 | 7,661 |
| 2002 | 4,649 | 4,566 | 7,223 | 6,531 | 7,616 | 6,689 | 3,945 | 4,384 | 4,571 | 4,856 | 4,780 | 5,326 |
| 2003 | 5,493 | 4,395 | 5,326 | 9,687 | 9,395 | 18,060 | 10,837 | 11,913 | 10,704 | 4,419 | 8,954 | 6,353 |
| 2004 | 7,615 | 8,100 | 11,016 | 8,193 | 10,090 | 10,467 | 15,249 | 9,136 | 7,649 | 6,786 | 7,689 | 9,442 |
| 2005 | 6,848 | 9,525 | 7,289 | 9,235 | 10,261 | 12,458 | 13,032 | 13,944 | 11,136 | 10,899 | 9,366 | 9,069 |
| 2006 | 18,937 | 10,728 | 9,178 | 13,314 | 14,957 | 17,437 | 17,207 | 19,827 | 17,739 | 18,678 | 10,310 | 13,352 |
| 2007 | 12,098 | 10,536 | 13,263 | 15,593 | 15,670 | 11,933 | 16,357 | 16,246 | 9,483 | 9,706 | 10,245 | 13,175 |
| 2008 | 13,030 | 6,900 | 11,627 | 11,374 | 9,510 | 8,783 | 11,628 | 10,991 | 14,194 | 13,023 | 13,553 | 9,648 |
| 2009 | 16,772 | 6,607 | 10,328 | 14,409 | 4,412 | 8,533 | 7,273 | 12,598 | 12,853 | 9,797 | 6,883 | 10,184 |
| 2010 | 10,275 | 7,738 | 9,769 | 10,597 | 11,703 | 10,647 | 9,072 | 10,887 | 10,159 | 8,734 | 12,134 | 8,679 |
| 2011 | 8,469 | 6,640 | 9,694 | 10,410 | 10,281 | 6,675 | 8,704 | 5,508 | 5,960 | 4,364 | 4,744 | 4,748 |
| 2012 | 3,991 | 4,017 | 5,844 | 4,295 | 4,542 | 4,725 | 3,198 | 4,302 | 3,360 | 3,215 | 3,162 | 1,362 |
| 2013 | 2,417 | 399 | 1,179 | 2,474 | 3,825 | 2,625 | 1,757 | 2,254 | 2,533 | 2,002 | 2,157 | 2,313 |
| 2014 | 1,740 | 1,353 | 2,375 | 1,198 | 1,210 | 2,961 | 2,697 | 3,075 | 3,697 | 1,588 | 1,629 | 2,400 |
| 2015 | 782 | 1,769 | 1,601 | 2,428 | 4,232 | 3,408 | 3,003 | 3,369 | 3,347 | 2,341 | 3,496 | 2,282 |
| 2016 | 3,896 | 5,042 | 3,755 | 4,047 | 2,788 | 4,493 | 3,973 | 3,503 | 3,127 | 3,620 | 5,927 | 3,988 |
| 2017 | 3,458 | 3,466 | 3,424 | 2,892 | 3,293 | 2,900 | 3,819 | 4,230 | 1,924 | 3,687 | 3,189 | 2,121 |
| 2018 | 2,996 | 1,676 | 1,344 | 2,309 | 1,877 | 2,024 | 1,680 | 1,496 | 2,376 | 1,981 | 2,265 | 2,043 |
| 2019 | 1,623 | 390 | 2,415 | 1,586 | 1,600 | 1,584 | 1,192 | 824 | 364 | 344 | ||
| 2020 | 16 | 117 | 80 | |||||||||
| 2021 | 301 | |||||||||||
| 2022 | 1,800 | 1,029 | 84 | 591 | 593 | |||||||
| 2023 | 319 | 127 | 782 | 916 | ||||||||
| 2024 | 9 | 381 | ||||||||||
| - = No Data Reported; -- = Not Applicable; NA = Not Available; W = Withheld to avoid disclosure of individual company data. |
| Release Date: 6/28/2024 |
| Next Release Date: 7/31/2024 |