|
Download Data (XLS File) |
|
||||||||
|
||||||||
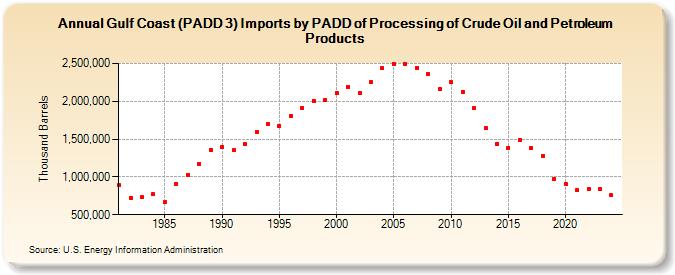
| Gulf Coast (PADD 3) Imports by PADD of Processing of Crude Oil and Petroleum Products (Thousand Barrels) | ||||||||
| Decade | Year-0 | Year-1 | Year-2 | Year-3 | Year-4 | Year-5 | Year-6 | Year-7 | Year-8 | Year-9 |
|---|---|---|---|---|---|---|---|---|---|---|
| 1980's | 887,084 | 727,438 | 730,059 | 768,846 | 666,979 | 907,423 | 1,029,251 | 1,171,194 | 1,356,231 | |
| 1990's | 1,398,254 | 1,354,520 | 1,431,235 | 1,599,443 | 1,696,114 | 1,677,060 | 1,809,501 | 1,916,419 | 2,008,656 | 2,012,210 |
| 2000's | 2,110,771 | 2,193,780 | 2,108,259 | 2,249,785 | 2,437,851 | 2,497,470 | 2,492,990 | 2,443,023 | 2,364,813 | 2,161,671 |
| 2010's | 2,254,145 | 2,129,181 | 1,905,552 | 1,650,598 | 1,438,615 | 1,385,579 | 1,491,825 | 1,379,746 | 1,280,492 | 972,795 |
| 2020's | 902,945 | 822,114 | 841,983 | 786,154 |
| - = No Data Reported; -- = Not Applicable; NA = Not Available; W = Withheld to avoid disclosure of individual company data. |
| Release Date: 3/29/2024 |
| Next Release Date: 8/30/2024 |