|
Download Data (XLS File) |
|
||||||||
|
||||||||
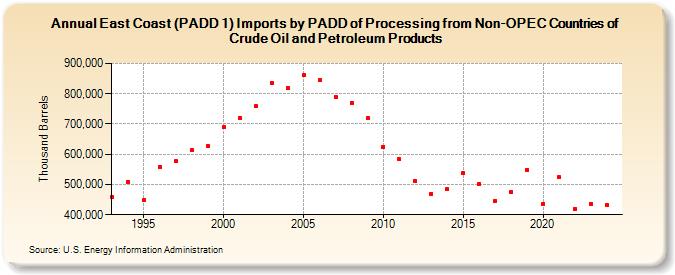
| East Coast (PADD 1) Imports by PADD of Processing from Non-OPEC Countries of Crude Oil and Petroleum Products (Thousand Barrels) | ||||||||
| Decade | Year-0 | Year-1 | Year-2 | Year-3 | Year-4 | Year-5 | Year-6 | Year-7 | Year-8 | Year-9 |
|---|---|---|---|---|---|---|---|---|---|---|
| 1990's | 458,599 | 509,029 | 447,459 | 558,139 | 576,685 | 612,786 | 627,542 | |||
| 2000's | 688,375 | 720,298 | 758,971 | 835,306 | 818,404 | 861,048 | 844,409 | 789,436 | 769,926 | 718,827 |
| 2010's | 624,707 | 583,340 | 510,688 | 470,096 | 483,782 | 537,062 | 501,602 | 446,768 | 476,554 | 549,434 |
| 2020's | 436,183 | 523,388 | 420,457 | 434,988 |
| - = No Data Reported; -- = Not Applicable; NA = Not Available; W = Withheld to avoid disclosure of individual company data. |
| Release Date: 6/28/2024 |
| Next Release Date: 8/30/2024 |