|
Download Data (XLS File) |
|
||||||||
|
||||||||
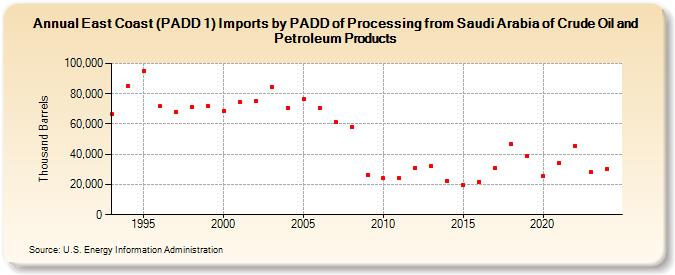
| East Coast (PADD 1) Imports by PADD of Processing from Saudi Arabia of Crude Oil and Petroleum Products (Thousand Barrels) | ||||||||
| Decade | Year-0 | Year-1 | Year-2 | Year-3 | Year-4 | Year-5 | Year-6 | Year-7 | Year-8 | Year-9 |
|---|---|---|---|---|---|---|---|---|---|---|
| 1990's | 66,351 | 85,176 | 95,151 | 71,668 | 68,139 | 70,923 | 72,002 | |||
| 2000's | 68,618 | 74,340 | 75,317 | 84,450 | 70,892 | 76,531 | 70,609 | 61,394 | 58,004 | 26,324 |
| 2010's | 24,005 | 24,273 | 31,120 | 32,097 | 22,428 | 19,822 | 21,739 | 30,947 | 46,870 | 38,815 |
| 2020's | 25,467 | 33,992 | 45,537 | 28,065 |
| - = No Data Reported; -- = Not Applicable; NA = Not Available; W = Withheld to avoid disclosure of individual company data. |
| Release Date: 8/30/2024 |
| Next Release Date: 8/29/2025 |