|
Download Data (XLS File) |
|
||||||||
|
||||||||
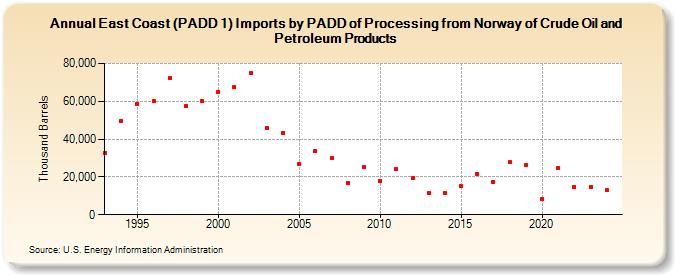
| East Coast (PADD 1) Imports by PADD of Processing from Norway of Crude Oil and Petroleum Products (Thousand Barrels) | ||||||||
| Decade | Year-0 | Year-1 | Year-2 | Year-3 | Year-4 | Year-5 | Year-6 | Year-7 | Year-8 | Year-9 |
|---|---|---|---|---|---|---|---|---|---|---|
| 1990's | 32,805 | 49,663 | 58,644 | 59,890 | 72,504 | 57,649 | 60,008 | |||
| 2000's | 65,112 | 67,338 | 74,707 | 45,908 | 43,379 | 26,931 | 33,594 | 30,224 | 16,990 | 25,034 |
| 2010's | 18,064 | 24,094 | 19,214 | 11,409 | 11,425 | 14,936 | 21,770 | 17,199 | 27,636 | 26,313 |
| 2020's | 8,464 | 24,798 | 14,833 | 14,447 |
| - = No Data Reported; -- = Not Applicable; NA = Not Available; W = Withheld to avoid disclosure of individual company data. |
| Release Date: 6/28/2024 |
| Next Release Date: 8/30/2024 |