|
Download Data (XLS File) |
|
||||||||
|
||||||||
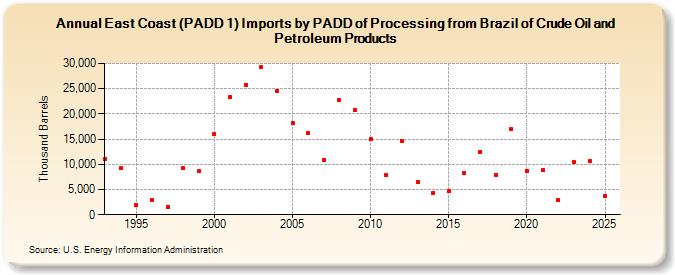
| East Coast (PADD 1) Imports by PADD of Processing from Brazil of Crude Oil and Petroleum Products (Thousand Barrels) | ||||||||
| Decade | Year-0 | Year-1 | Year-2 | Year-3 | Year-4 | Year-5 | Year-6 | Year-7 | Year-8 | Year-9 |
|---|---|---|---|---|---|---|---|---|---|---|
| 1990's | 11,051 | 9,292 | 1,912 | 2,981 | 1,522 | 9,174 | 8,679 | |||
| 2000's | 15,972 | 23,309 | 25,736 | 29,266 | 24,640 | 18,200 | 16,119 | 10,918 | 22,692 | 20,779 |
| 2010's | 15,017 | 7,784 | 14,530 | 6,505 | 4,306 | 4,631 | 8,242 | 12,457 | 7,935 | 16,926 |
| 2020's | 8,746 | 8,849 | 2,841 | 10,376 |
| - = No Data Reported; -- = Not Applicable; NA = Not Available; W = Withheld to avoid disclosure of individual company data. |
| Release Date: 3/29/2024 |
| Next Release Date: 8/30/2024 |