|
Download Data (XLS File) |
|
||||||||
|
||||||||
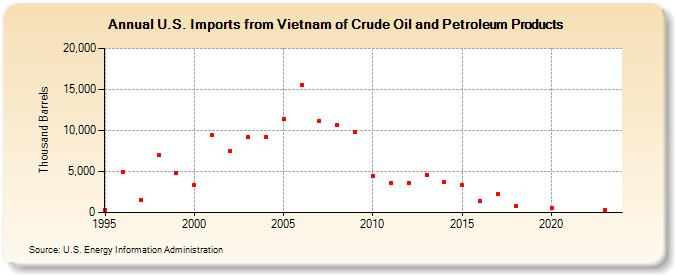
| U.S. Imports from Vietnam of Crude Oil and Petroleum Products (Thousand Barrels) | ||||||||
| Decade | Year-0 | Year-1 | Year-2 | Year-3 | Year-4 | Year-5 | Year-6 | Year-7 | Year-8 | Year-9 |
|---|---|---|---|---|---|---|---|---|---|---|
| 1990's | 346 | 4,999 | 1,557 | 6,993 | 4,876 | |||||
| 2000's | 3,303 | 9,432 | 7,555 | 9,209 | 9,256 | 11,400 | 15,545 | 11,156 | 10,628 | 9,810 |
| 2010's | 4,471 | 3,583 | 3,594 | 4,586 | 3,743 | 3,320 | 1,403 | 2,307 | 788 | |
| 2020's | 614 | 285 |
| - = No Data Reported; -- = Not Applicable; NA = Not Available; W = Withheld to avoid disclosure of individual company data. |
| Release Date: 6/28/2024 |
| Next Release Date: 8/30/2024 |