|
Download Data (XLS File) |
|
||||||||
|
||||||||
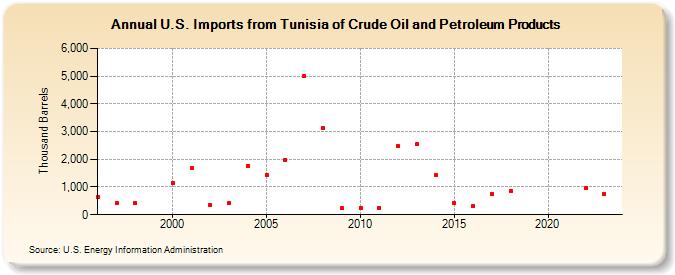
| U.S. Imports from Tunisia of Crude Oil and Petroleum Products (Thousand Barrels) | ||||||||
| Decade | Year-0 | Year-1 | Year-2 | Year-3 | Year-4 | Year-5 | Year-6 | Year-7 | Year-8 | Year-9 |
|---|---|---|---|---|---|---|---|---|---|---|
| 1990's | 654 | 439 | 413 | |||||||
| 2000's | 1,154 | 1,680 | 352 | 425 | 1,759 | 1,433 | 1,975 | 5,003 | 3,114 | 229 |
| 2010's | 260 | 249 | 2,477 | 2,540 | 1,420 | 424 | 312 | 752 | 848 | |
| 2020's | 966 | 755 |
| - = No Data Reported; -- = Not Applicable; NA = Not Available; W = Withheld to avoid disclosure of individual company data. |
| Release Date: 6/28/2024 |
| Next Release Date: 8/30/2024 |