|
Download Data (XLS File) |
|
||||||||
|
||||||||
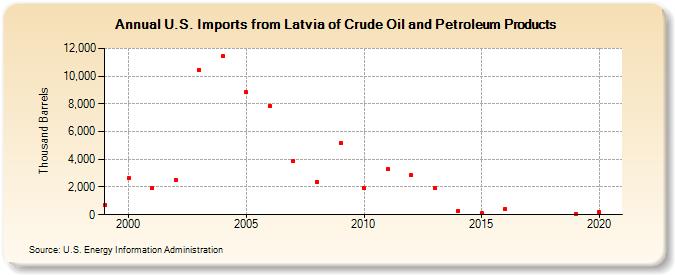
| U.S. Imports from Latvia of Crude Oil and Petroleum Products (Thousand Barrels) | ||||||||
| Decade | Year-0 | Year-1 | Year-2 | Year-3 | Year-4 | Year-5 | Year-6 | Year-7 | Year-8 | Year-9 |
|---|---|---|---|---|---|---|---|---|---|---|
| 1990's | 735 | |||||||||
| 2000's | 2,631 | 1,918 | 2,505 | 10,443 | 11,445 | 8,835 | 7,860 | 3,851 | 2,347 | 5,174 |
| 2010's | 1,906 | 3,270 | 2,832 | 1,948 | 287 | 92 | 417 | 69 | ||
| 2020's | 169 |
| - = No Data Reported; -- = Not Applicable; NA = Not Available; W = Withheld to avoid disclosure of individual company data. |
| Release Date: 6/28/2024 |
| Next Release Date: 8/30/2024 |