|
Download Data (XLS File) |
|
||||||||
|
||||||||
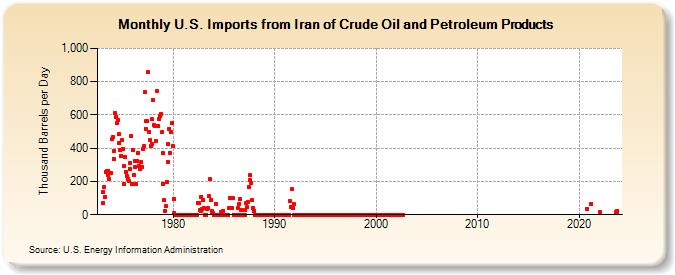
| U.S. Imports from Iran of Crude Oil and Petroleum Products (Thousand Barrels per Day) | ||||||||
| Year | Jan | Feb | Mar | Apr | May | Jun | Jul | Aug | Sep | Oct | Nov | Dec |
|---|---|---|---|---|---|---|---|---|---|---|---|---|
| 1973 | 69 | 138 | 167 | 109 | 258 | 261 | 236 | 264 | 212 | 248 | 249 | 453 |
| 1974 | 467 | 336 | 383 | 612 | 586 | 551 | 571 | 486 | 432 | 388 | 355 | 449 |
| 1975 | 398 | 292 | 182 | 346 | 256 | 232 | 217 | 203 | 277 | 311 | 473 | 186 |
| 1976 | 388 | 241 | 287 | 323 | 184 | 323 | 374 | 294 | 275 | 284 | 317 | 289 |
| 1977 | 397 | 412 | 735 | 517 | 563 | 563 | 857 | 500 | 449 | 413 | 423 | 573 |
| 1978 | 690 | 539 | 535 | 442 | 746 | 536 | 532 | 574 | 591 | 608 | 495 | 369 |
| 1979 | 187 | 86 | 22 | 52 | 197 | 318 | 425 | 516 | 373 | 496 | 549 | 414 |
| 1980 | 95 | 9 | 0 | 0 | 0 | 0 | 0 | 0 | 0 | 0 | 0 | 0 |
| 1981 | 0 | 0 | 0 | 0 | 0 | 0 | 0 | 0 | 0 | 0 | 0 | 0 |
| 1982 | 0 | 0 | 0 | 0 | 0 | 72 | 69 | 27 | 21 | 108 | 34 | 88 |
| 1983 | 43 | 0 | 0 | 0 | 37 | 38 | 112 | 213 | 86 | 12 | 21 | 9 |
| 1984 | 0 | 0 | 67 | 0 | 0 | 0 | 0 | 0 | 17 | 0 | 24 | 12 |
| 1985 | 0 | 0 | 0 | 0 | 0 | 0 | 42 | 100 | 43 | 41 | 99 | 0 |
| 1986 | 0 | 0 | 0 | 0 | 40 | 0 | 66 | 93 | 31 | 0 | 0 | 0 |
| 1987 | 0 | 30 | 73 | 47 | 75 | 165 | 237 | 208 | 193 | 86 | 41 | 23 |
| 1988 | 1 | 0 | 0 | 0 | 0 | 0 | 0 | 0 | 0 | 0 | 0 | 0 |
| 1989 | 0 | 0 | 0 | 0 | 0 | 0 | 0 | 0 | 0 | 0 | 0 | 0 |
| 1990 | 0 | 0 | 0 | 0 | 0 | 0 | 0 | 0 | 0 | 0 | 0 | 0 |
| 1991 | 0 | 0 | 0 | 0 | 0 | 0 | 81 | 48 | 152 | 43 | 64 | 0 |
| 1992 | 0 | 0 | 0 | 0 | 0 | 0 | 0 | 0 | 0 | 0 | 0 | 0 |
| 1993 | 0 | 0 | 0 | 0 | 0 | 0 | 0 | 0 | 0 | 0 | 0 | 0 |
| 1994 | 0 | 0 | 0 | 0 | 0 | 0 | 0 | 0 | 0 | 0 | 0 | 0 |
| 1995 | 0 | 0 | 0 | 0 | 0 | 0 | 0 | 0 | 0 | 0 | 0 | 0 |
| 1996 | 0 | 0 | 0 | 0 | 0 | 0 | 0 | 0 | 0 | 0 | 0 | 0 |
| 1997 | 0 | 0 | 0 | 0 | 0 | 0 | 0 | 0 | 0 | 0 | 0 | 0 |
| 1998 | 0 | 0 | 0 | 0 | 0 | 0 | 0 | 0 | 0 | 0 | 0 | 0 |
| 1999 | 0 | 0 | 0 | 0 | 0 | 0 | 0 | 0 | 0 | 0 | 0 | 0 |
| 2000 | 0 | 0 | 0 | 0 | 0 | 0 | 0 | 0 | 0 | 0 | 0 | 0 |
| 2001 | 0 | 0 | 0 | 0 | 0 | 0 | 0 | 0 | 0 | 0 | 0 | 0 |
| 2002 | 0 | 0 | 0 | 0 | 0 | 0 | 0 | 0 | ||||
| 2020 | 36 | |||||||||||
| 2021 | 66 | |||||||||||
| 2022 | 16 | |||||||||||
| 2023 | 14 | 18 | 24 | |||||||||
| - = No Data Reported; -- = Not Applicable; NA = Not Available; W = Withheld to avoid disclosure of individual company data. |
| Release Date: 6/28/2024 |
| Next Release Date: 7/31/2024 |