|
Download Data (XLS File) |
|
||||||||
|
||||||||
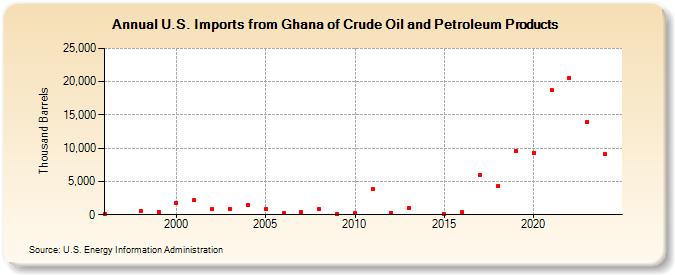
| U.S. Imports from Ghana of Crude Oil and Petroleum Products (Thousand Barrels) | ||||||||
| Decade | Year-0 | Year-1 | Year-2 | Year-3 | Year-4 | Year-5 | Year-6 | Year-7 | Year-8 | Year-9 |
|---|---|---|---|---|---|---|---|---|---|---|
| 1990's | 171 | 599 | 476 | |||||||
| 2000's | 1,770 | 2,168 | 880 | 923 | 1,512 | 881 | 197 | 422 | 831 | 37 |
| 2010's | 215 | 3,832 | 313 | 993 | 81 | 473 | 5,998 | 4,323 | 9,520 | |
| 2020's | 9,325 | 18,756 | 20,534 | 13,977 |
| - = No Data Reported; -- = Not Applicable; NA = Not Available; W = Withheld to avoid disclosure of individual company data. |
| Release Date: 6/28/2024 |
| Next Release Date: 8/30/2024 |