|
Download Data (XLS File) |
|
||||||||
|
||||||||
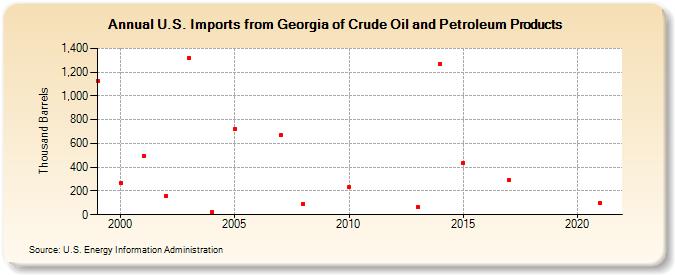
| U.S. Imports from Georgia of Crude Oil and Petroleum Products (Thousand Barrels) | ||||||||
| Decade | Year-0 | Year-1 | Year-2 | Year-3 | Year-4 | Year-5 | Year-6 | Year-7 | Year-8 | Year-9 |
|---|---|---|---|---|---|---|---|---|---|---|
| 1990's | 1,129 | |||||||||
| 2000's | 268 | 498 | 158 | 1,322 | 19 | 722 | 669 | 92 | ||
| 2010's | 233 | 63 | 1,269 | 437 | 295 | |||||
| 2020's | 98 |
| - = No Data Reported; -- = Not Applicable; NA = Not Available; W = Withheld to avoid disclosure of individual company data. |
| Release Date: 3/29/2024 |
| Next Release Date: 8/30/2024 |