|
Download Data (XLS File) |
|
||||||||
|
||||||||
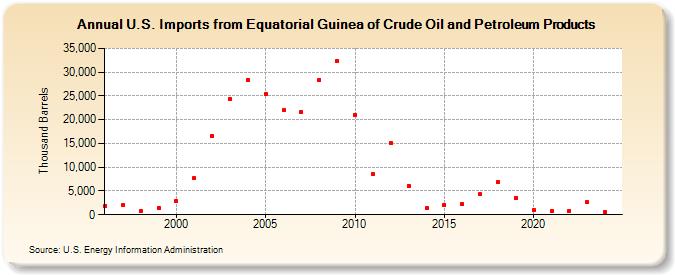
| U.S. Imports from Equatorial Guinea of Crude Oil and Petroleum Products (Thousand Barrels) | ||||||||
| Decade | Year-0 | Year-1 | Year-2 | Year-3 | Year-4 | Year-5 | Year-6 | Year-7 | Year-8 | Year-9 |
|---|---|---|---|---|---|---|---|---|---|---|
| 1990's | 1,817 | 1,972 | 732 | 1,413 | ||||||
| 2000's | 2,799 | 7,664 | 16,570 | 24,377 | 28,450 | 25,385 | 21,957 | 21,597 | 28,439 | 32,310 |
| 2010's | 21,063 | 8,500 | 15,100 | 6,073 | 1,392 | 2,080 | 2,250 | 4,328 | 6,881 | 3,559 |
| 2020's | 955 | 696 | 813 | 2,597 |
| - = No Data Reported; -- = Not Applicable; NA = Not Available; W = Withheld to avoid disclosure of individual company data. |
| Release Date: 6/28/2024 |
| Next Release Date: 8/30/2024 |