|
Download Data (XLS File) |
|
||||||||
|
||||||||
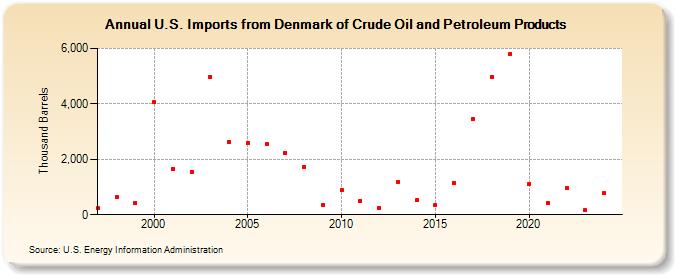
| U.S. Imports from Denmark of Crude Oil and Petroleum Products (Thousand Barrels) | ||||||||
| Decade | Year-0 | Year-1 | Year-2 | Year-3 | Year-4 | Year-5 | Year-6 | Year-7 | Year-8 | Year-9 |
|---|---|---|---|---|---|---|---|---|---|---|
| 1990's | 226 | 636 | 439 | |||||||
| 2000's | 4,059 | 1,662 | 1,542 | 4,982 | 2,631 | 2,576 | 2,541 | 2,238 | 1,731 | 365 |
| 2010's | 900 | 501 | 256 | 1,190 | 520 | 358 | 1,161 | 3,451 | 4,979 | 5,813 |
| 2020's | 1,119 | 430 | 960 | 157 |
| - = No Data Reported; -- = Not Applicable; NA = Not Available; W = Withheld to avoid disclosure of individual company data. |
| Release Date: 8/30/2024 |
| Next Release Date: 8/29/2025 |