|
Download Data (XLS File) |
|
||||||||
|
||||||||
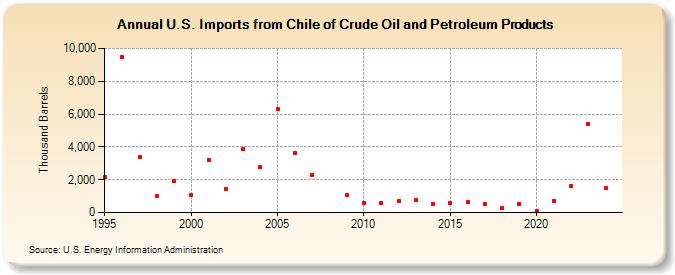
| U.S. Imports from Chile of Crude Oil and Petroleum Products (Thousand Barrels) | ||||||||
| Decade | Year-0 | Year-1 | Year-2 | Year-3 | Year-4 | Year-5 | Year-6 | Year-7 | Year-8 | Year-9 |
|---|---|---|---|---|---|---|---|---|---|---|
| 1990's | 2,165 | 9,446 | 3,383 | 1,013 | 1,938 | |||||
| 2000's | 1,046 | 3,224 | 1,438 | 3,845 | 2,766 | 6,323 | 3,614 | 2,314 | 1,052 | |
| 2010's | 596 | 601 | 711 | 752 | 515 | 596 | 664 | 511 | 283 | 540 |
| 2020's | 90 | 731 | 1,594 | 5,391 |
| - = No Data Reported; -- = Not Applicable; NA = Not Available; W = Withheld to avoid disclosure of individual company data. |
| Release Date: 3/29/2024 |
| Next Release Date: 8/30/2024 |