|
Download Data (XLS File) |
|
||||||||
|
||||||||
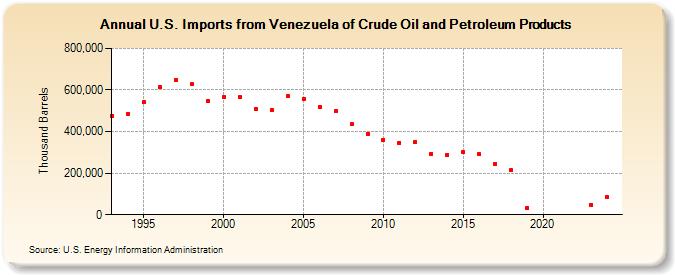
| U.S. Imports from Venezuela of Crude Oil and Petroleum Products (Thousand Barrels) | ||||||||
| Decade | Year-0 | Year-1 | Year-2 | Year-3 | Year-4 | Year-5 | Year-6 | Year-7 | Year-8 | Year-9 |
|---|---|---|---|---|---|---|---|---|---|---|
| 1990's | 474,647 | 486,808 | 540,296 | 613,410 | 647,095 | 627,416 | 544,798 | |||
| 2000's | 565,865 | 566,996 | 510,362 | 502,328 | 568,944 | 558,157 | 517,947 | 496,684 | 435,029 | 387,856 |
| 2010's | 360,526 | 346,989 | 351,220 | 294,259 | 288,127 | 301,989 | 291,461 | 245,980 | 213,895 | 33,666 |
| 2020's | 48,742 |
| - = No Data Reported; -- = Not Applicable; NA = Not Available; W = Withheld to avoid disclosure of individual company data. |
| Release Date: 6/28/2024 |
| Next Release Date: 8/30/2024 |