|
Download Data (XLS File) |
|
||||||||
|
||||||||
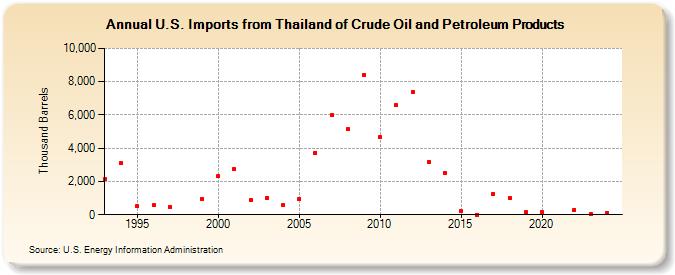
| U.S. Imports from Thailand of Crude Oil and Petroleum Products (Thousand Barrels) | ||||||||
| Decade | Year-0 | Year-1 | Year-2 | Year-3 | Year-4 | Year-5 | Year-6 | Year-7 | Year-8 | Year-9 |
|---|---|---|---|---|---|---|---|---|---|---|
| 1990's | 2,147 | 3,105 | 498 | 566 | 488 | 969 | ||||
| 2000's | 2,303 | 2,732 | 864 | 1,031 | 563 | 955 | 3,737 | 5,993 | 5,148 | 8,419 |
| 2010's | 4,652 | 6,580 | 7,368 | 3,174 | 2,519 | 213 | 2 | 1,268 | 1,008 | 137 |
| 2020's | 155 | 302 | 15 |
| - = No Data Reported; -- = Not Applicable; NA = Not Available; W = Withheld to avoid disclosure of individual company data. |
| Release Date: 6/28/2024 |
| Next Release Date: 8/30/2024 |