|
Download Data (XLS File) |
|
||||||||
|
||||||||
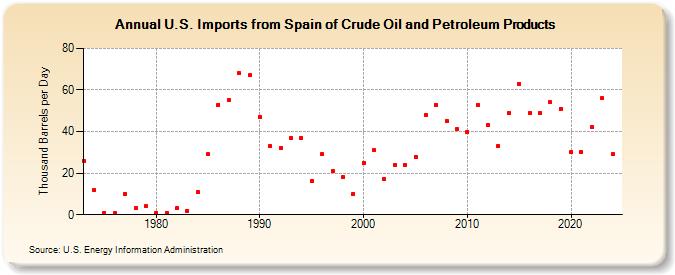
| U.S. Imports from Spain of Crude Oil and Petroleum Products (Thousand Barrels per Day) | ||||||||
| Decade | Year-0 | Year-1 | Year-2 | Year-3 | Year-4 | Year-5 | Year-6 | Year-7 | Year-8 | Year-9 |
|---|---|---|---|---|---|---|---|---|---|---|
| 1970's | 26 | 12 | 1 | 1 | 10 | 3 | 4 | |||
| 1980's | 1 | 1 | 3 | 2 | 11 | 29 | 53 | 55 | 68 | 67 |
| 1990's | 47 | 33 | 32 | 37 | 37 | 16 | 29 | 21 | 18 | 10 |
| 2000's | 25 | 31 | 17 | 24 | 24 | 28 | 48 | 53 | 45 | 41 |
| 2010's | 40 | 53 | 43 | 33 | 49 | 63 | 49 | 49 | 54 | 51 |
| 2020's | 30 | 30 | 42 | 56 |
| - = No Data Reported; -- = Not Applicable; NA = Not Available; W = Withheld to avoid disclosure of individual company data. |
| Release Date: 8/30/2024 |
| Next Release Date: 8/29/2025 |