|
Download Data (XLS File) |
|
||||||||
|
||||||||
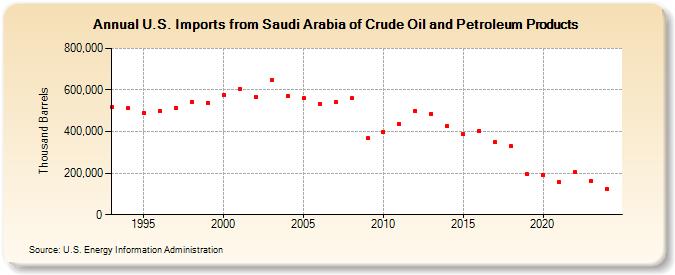
| U.S. Imports from Saudi Arabia of Crude Oil and Petroleum Products (Thousand Barrels) | ||||||||
| Decade | Year-0 | Year-1 | Year-2 | Year-3 | Year-4 | Year-5 | Year-6 | Year-7 | Year-8 | Year-9 |
|---|---|---|---|---|---|---|---|---|---|---|
| 1990's | 516,009 | 511,911 | 490,487 | 498,730 | 513,693 | 544,301 | 539,562 | |||
| 2000's | 575,274 | 606,753 | 566,512 | 647,666 | 570,137 | 560,823 | 534,143 | 541,987 | 559,750 | 366,605 |
| 2010's | 400,127 | 436,020 | 499,595 | 484,934 | 425,769 | 386,505 | 404,925 | 348,621 | 328,736 | 193,556 |
| 2020's | 190,929 | 156,909 | 204,162 | 160,276 |
| - = No Data Reported; -- = Not Applicable; NA = Not Available; W = Withheld to avoid disclosure of individual company data. |
| Release Date: 3/29/2024 |
| Next Release Date: 8/30/2024 |